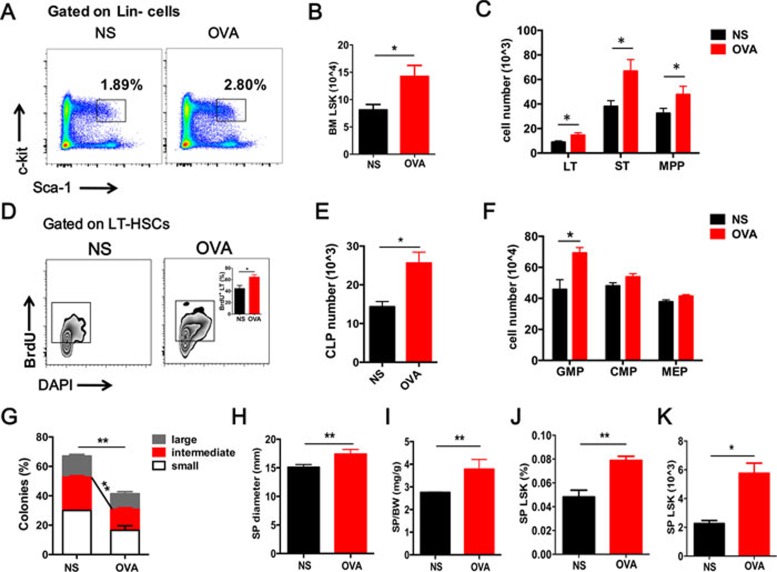
Figure 1.
Impaired hematopoietic stem cell homeostasis in allergen-induced airway inflammation. (A, B) Representative FACS plots and quantification of HSCs (LSKs, Lin−Sca-1+c-Kit+) from the bone marrow (BM) of the OVA-treated mice (OVA) and controls (NS). (C) Absolute numbers of stem cells at different stages, including LT-HSCs (CD34−Flk2−LSKs), ST-HSCs (CD34+Flk2−LSKs) and MPPs (CD34+Flk2+LSKs). (D) BrdU incorporation assay (24 h) of BM LT-HSCs from the OVA-treated mice (OVA) and controls (NS). (E, F) Absolute numbers of progenitor cells in the BM. CLP, common lymphoid progenitors; GMP, granulocyte/monocyte lineage progenitors; CMP, common myeloid progenitors; MEP, megakaryocyte/erythroid progenitors. (G) A single LT-HSC was sorted into a 96-well plate to perform a colony forming assay. The percentage of colonies was calculated by dividing the original cell number in each colony (n= 3). (H, I) Changes in spleen appearances: long diameter and spleen weight compared with body weight. (J, K) Percentage of LSK cells in Lin− cells (J) and quantification numbers (K) in the spleen (SP). Data are shown as the means ± SEM with at least six samples per group. *P < 0.05, **P < 0.01 versus respective controls.

