Figure 2.
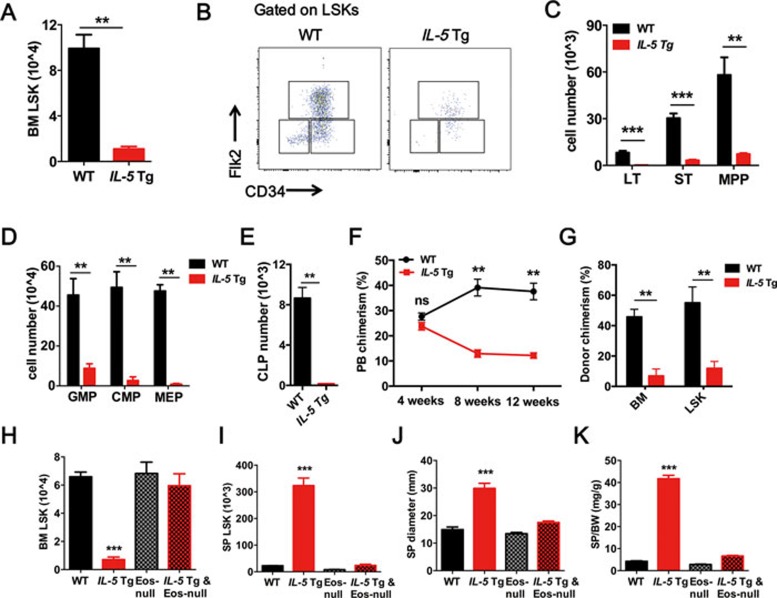
Eos-dependent HSC impairment in IL-5 Tg mice. (A) Quantification of LSKs from the BM of WT and IL-5 Tg mice. (B, C) Representative FACS plots and quantification of LT-HSCs, ST-HSCs and MPP-HSCs from the BM. (D, E) Absolute numbers of progenitor cells in the BM. (F) Percentage of donor-derived peripheral blood (PB) cells at 4, 8 and 12 weeks after competitive LSK transplantation. (G) Percentage of donor-derived total BM cells and LSKs after 12 weeks of reconstitution in competitive BM transplants. (H, I) Absolute numbers of LSKs in the BM (H) and SP (I). (J, K) Changes in spleen appearances: long diameter and weight ratio with body weight. Data are shown as the means ± SEM with six samples per group. **P < 0.01, ***P < 0.001 versus respective controls. CLP, common lymphoid progenitors; CMP, common myeloid progenitors; GMP, granulocyte/monocyte lineage progenitors; MEP, megakaryocyte/erythroid progenitors.

