
Figure 6.
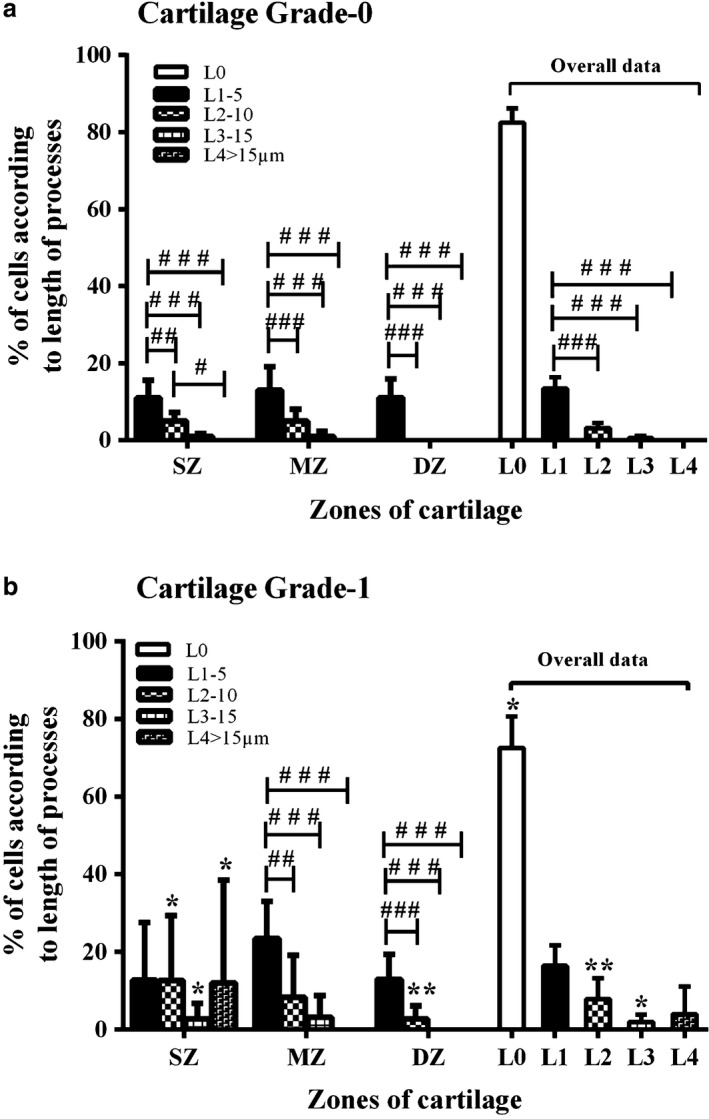
Abnormal chondrocyte morphology with cartilage depth and grade. Histograms show pooled data for the percentage of chondrocytes with cytoplasmic processes of various lengths in the superficial (SZ), mid‐(MZ) and deep zones (DZ) of (a) grade‐0 and (b) grade‐1 human femoral head articular cartilage. Data (mean ± 95% CI) were from N(n) = 11(1398) and N(n) 5(551) for grade‐0 and grade‐1 cartilage explants, respectively. A hash symbol (#) indicates a significant difference according to one‐way analysis of variance followed by Tukey's multiple comparison post‐hoc test. An asterisk (*) showed a significant difference between grade‐0 and grade‐1 cartilage explants according to Student's t‐test. The single, double and triple symbols showed the level of significance for P < 0.05, 0.01 and 0.001, respectively.