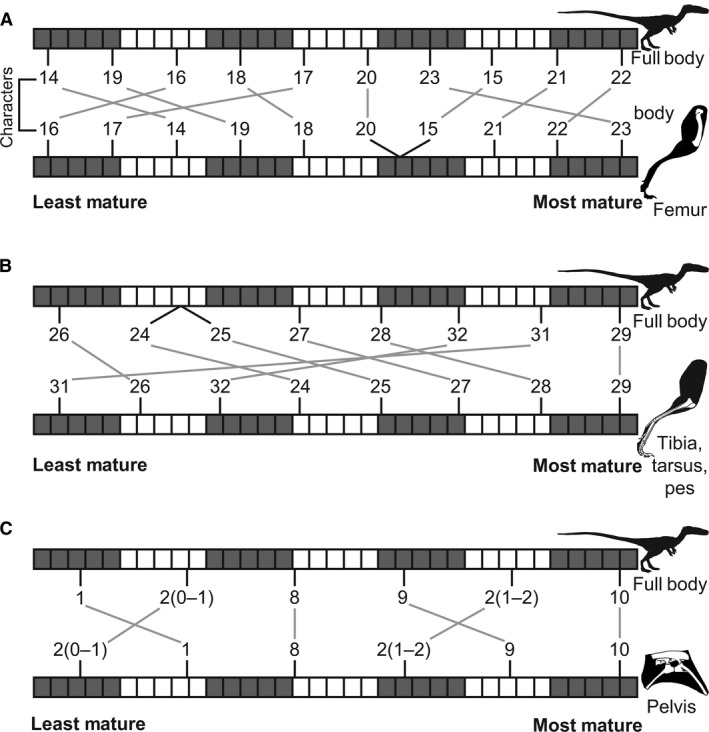
Figure 19.

Comparisons between the modal developmental sequences of the full body dataset and femoral, lower hindlimb (tibia, tarsus, pes), and pelvic datasets of Coelophysis bauri. (A) Modal sequence of femoral characters in the full‐body OSA (top) and the femoral OSA (bottom). (B) Modal sequence of tibial, tarsal, and pedal characters in the full‐body OSA (top) and the tibial, tarsal, and pedal OSA (bottom). (C) Modal sequence of pelvic characters in the full‐body OSA (top) and the pelvic OSA (bottom).
