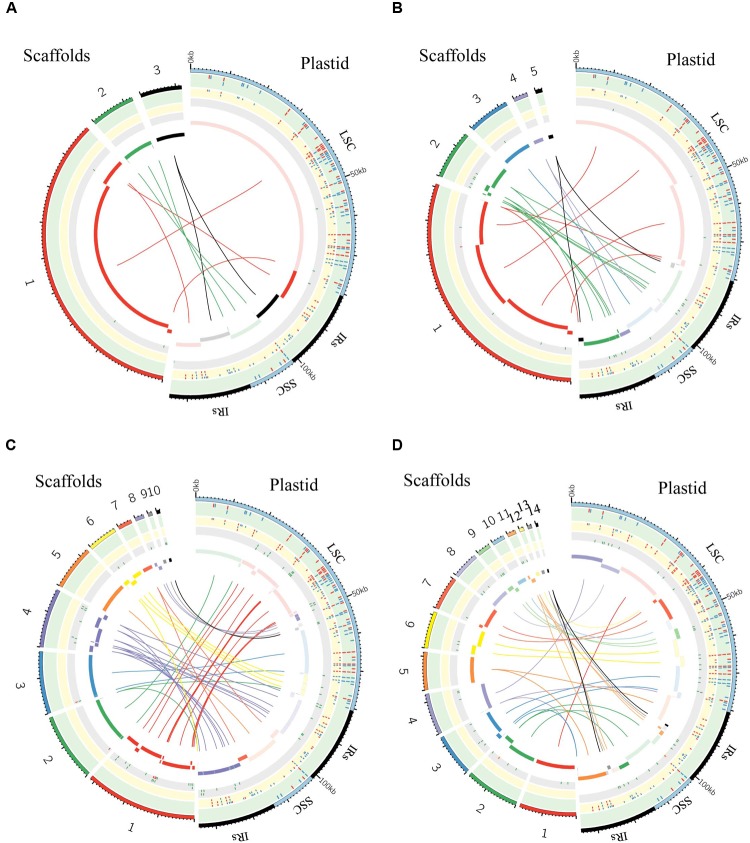
FIGURE 6.
Graphic summary of de novo assembly of whole plastid genome. Scaffolds and SNPs/Indels positions: (A) purified chloroplast cpDNA; (B) the total genomic DNA_1; (C) the total genomic DNA_2; (D) the total genomic DNA_3. The assembled scaffolds (>500 bp) were aligned to the plastid reference genome by NCBI BLAST 2, and the hit regions are indicated by central colored ribbons and bars. Scaffold hits in the opposite direction to the reference genome are represented with lightest color in the bar on the side marked “Plastid.” Detected SNPs (red tick marks) and indels (blue tick marks) are plotted in the green (GATK, Table 3) and yellow (de novo assembly) tracks (Supplementary Table 3). Regions of undetermined base positions (‘N’; green tick marks) and sequencing artifacts such as insertions of mitochondrial homology sequence (red tick marks) and duplication of plastid sequence (orange tick marks) are plotted in the gray track (Supplementary Table 5). LSC, large single-copy; SSC, small single-copy; IRs, pair of inverted repeats.

