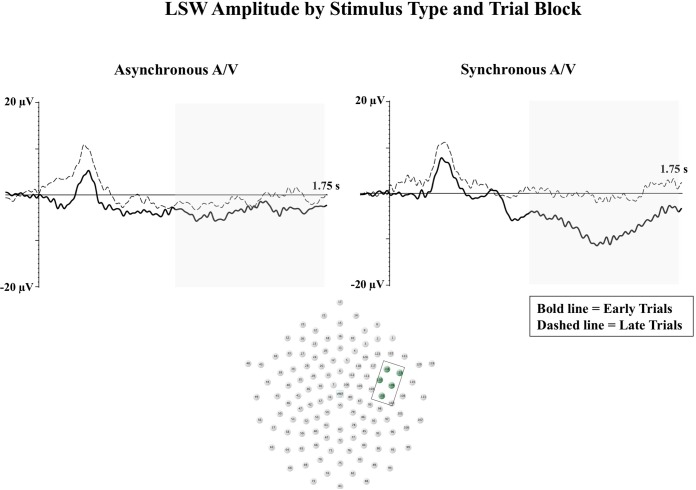
FIGURE 2.
The LSW is shown for early (bold line) and late (dashed line) blocks of trials at right anterior temporal electrodes. Waveforms from the synchronous audiovisual condition are shown in the right panel, and waveforms from the asynchronous audiovisual condition are shown in the left panel. The Y-axis represents the amplitude of the ERP in microvolts, and the X-axis represents time following stimulus onset. The time-window of the component analysis is shaded on the X-axis. The positioning of the electrodes included in the analysis are shown in the bottom panel (Figure adapted from Reynolds et al., 2014).

