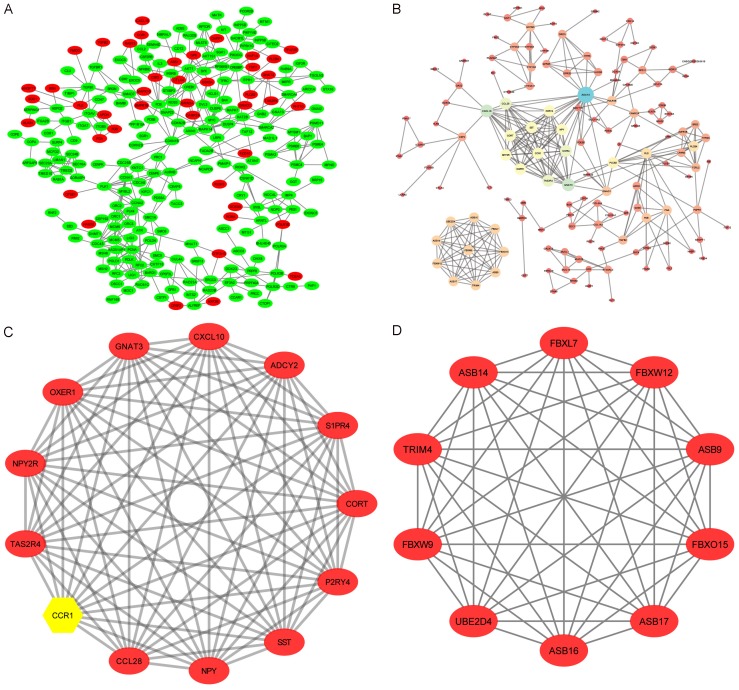
Figure 7.
Protein-protein interaction (PPI) network and modular analysis of DEGs. A. Red nodes represent up-regulated DEGs while green nodes represent the down-regulated genes. B. Another PPI network was constructed for all the up-regulated genes with a PPI score >0.7. C, D. Two modules were obtained from the PPI network of all up-regulated DEGs and CCR1 (yellow) is a hub gene.

