Figure 1.

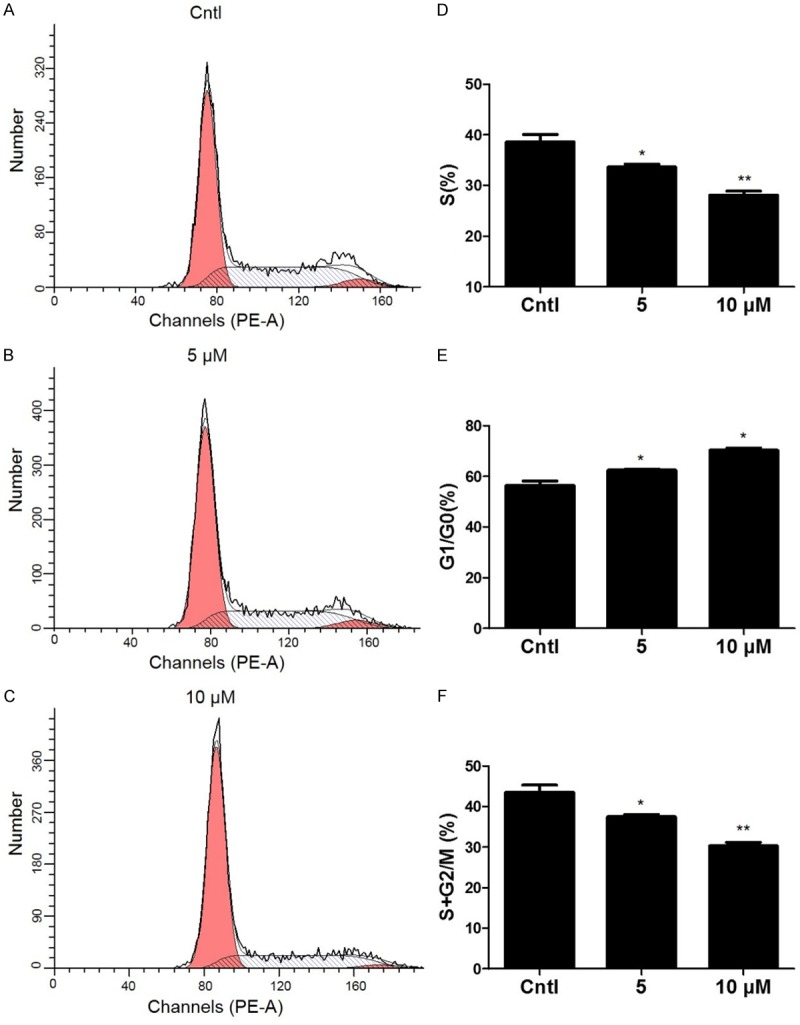
The effect of DHA on cell cycle progression in MCs. The percentage of cells at different cell cycle phases was detected by flow cytometry after MCs were treated with the indicated doses of DHA for 24 h. A-C. Representative images of cell cycle with different doses of DHA. D-F. Percentage of cells at S, G1/G0, and (S+G2)/M phases. Values are means ± SE; n = 6 for each group. *P<0.05 vs. control, **P<0.01 vs. control.
