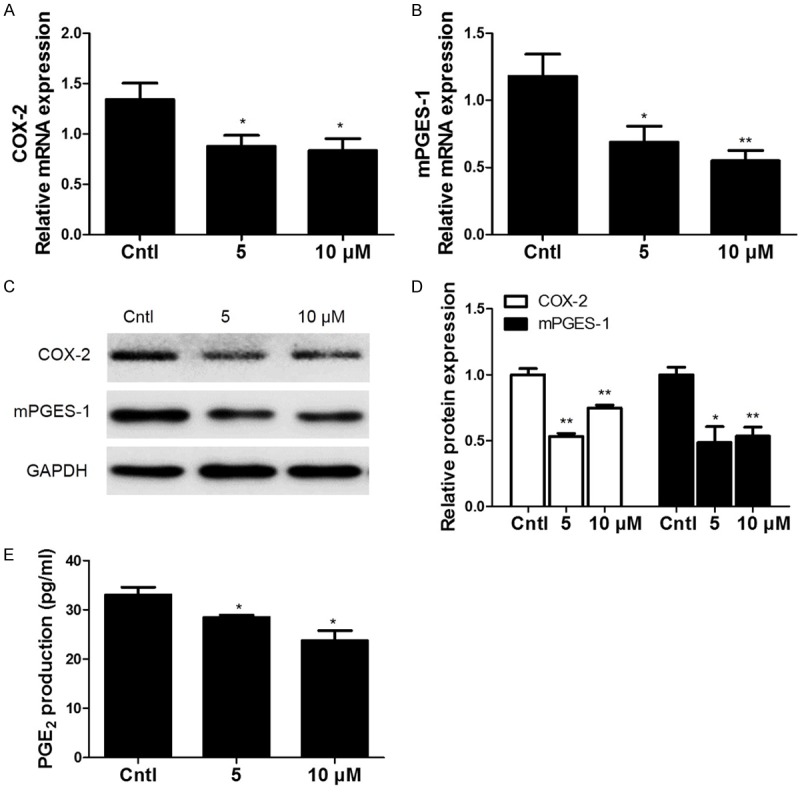
Figure 3.

Expressions of COX-2 and mPGES-1 in DHA-treated MCs. MCs were treated with the indicated doses of DHA (5, 10 μM) for 24 h and then COX-2 and mPGES-1 mRNA and protein expressions (A-D) were analyzed by qRT-PCR and Western blotting. (E) Enzyme immunoassay of PGE2 in the medium. Values are means ± SE; n = 6 for each group. *P<0.05 vs. control, **P<0.01 vs. control.
