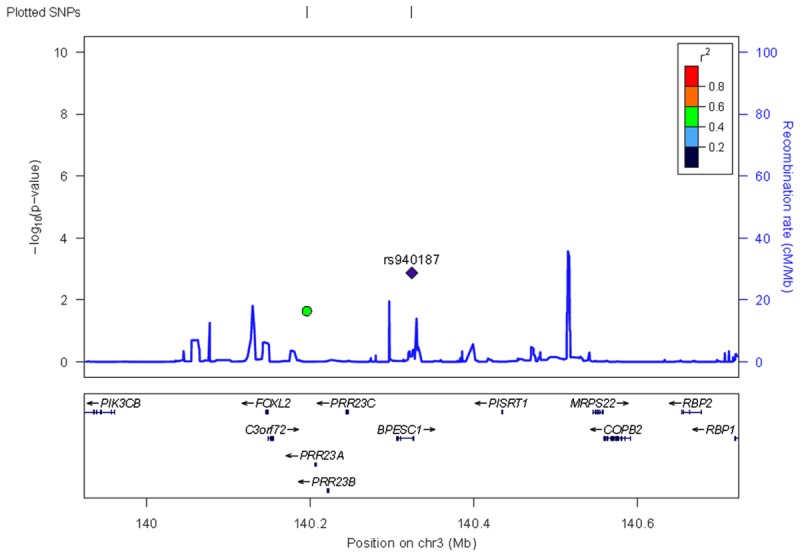
Figure 1.

Regional association plots showing signals in replication samples for 3q22.3. The P-values of SNPs (shown as -log10 values in y-axis, from the genome-wide single-marker association analysis) were plotted against their map positions (x-axis). Gene annotations were adapted from the University of California at SantaCruz Genome Browser (http://genome.ucsc.edu/).
