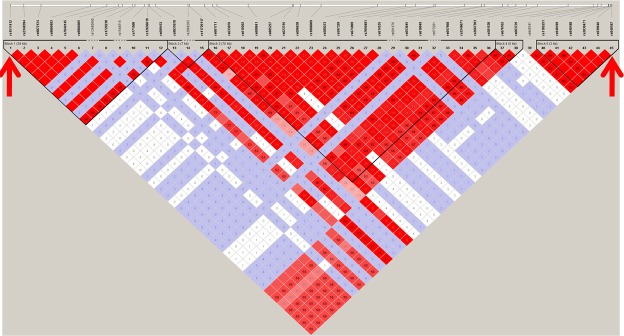
Figure 2.
The LD pattern of the 3q22.3 region in populations of Chinese and Japanese ancestry. The LD pattern (r2) was created in the Haploview by using the genotyping data (only SNPs with MAF > 0.01) from the HapMap project. The positions of the two SNPs (rs1511412, rs940187) identified in this study are indicated by red arrows. It shows there were several independent LD blocks in the entire region, and the high r2 value (0.58) indicates these two SNPs were in LD.

