Figure 1.

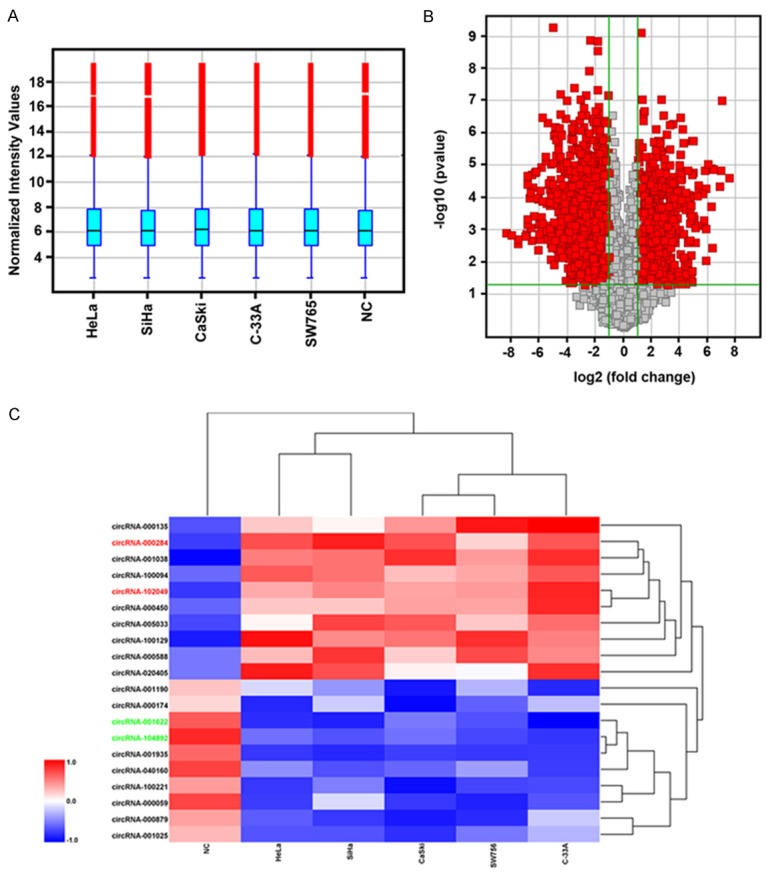
CircRNA profile expression in cervical cancer cells. A: Box plot showed the normalized intensities from five cervical cancer cell lines and one normal cervical epithelial cells (NC). B: Volcano plot of the differentially expressed circRNAs. The vertical lines correspond to 2.0-fold up and down, respectively, and the horizontal line represents a p-value of 0.05. The red point in the plot represents the differentially expressed circRNAs with statistical significance. C: Heat map showed the selected 10 upregulated and 10 downregulated circRNAs. Red indicated the upregulated expression with high fold-change and blue indicated the downregulated expression with low fold-change.
