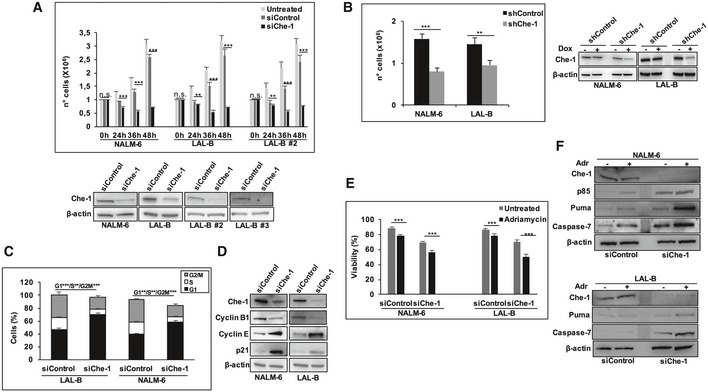
Proliferation assay was performed in NALM‐6, LAL‐B, and LAL‐B#2 cells upon 24, 36, and 48 h of siRNA nucleoporation. Error bars represent the standard error of three different experiments (upper panel). WB analysis of total cell extracts (TCEs) from NALM‐6, LAL‐B, LAL‐B#2, LAL‐B#3 cells transiently transfected by nucleo‐electroporation with siRNA targeting Che‐1 (siChe‐1) or with siRNA for a control sequence (siControl) for 36 h. β‐actin was used as loading control (bottom panel).
NALM‐6 and LAL‐B cells were infected with LV‐THsh/Che‐1 (shChe‐1) or LV/THsh/Control (shControl) and LV‐tTR‐KRAB lentiviruses. TCEs from cells induced (+Dox) or not (−Dox) were analyzed by cell number (left panel) and WB (right panel). Error bars represent the standard error of three different experiments.
Cells treated as in (A) were fixed and stained with propidium iodide (PI) and analyzed for DNA content by flow cytometry. Error bars represent the standard error of three different experiments.
TCEs from NALM‐6 and LAL‐B cells nucleoporated as in (A) were blotted and analyzed with the indicated Abs. β‐actin was used as loading control.
Viability assay performed in NALM‐6 and LAL‐B cells interfered for Che‐1 expression and treated for 48 h with adriamycin (2 μM) at the same time. Error bars represent the standard error of three different experiments.
TCEs from NALM‐6 and LAL‐B cells treated as in (E) were blotted and analyzed with the indicated Abs. β‐actin was used as loading control.
‐test.