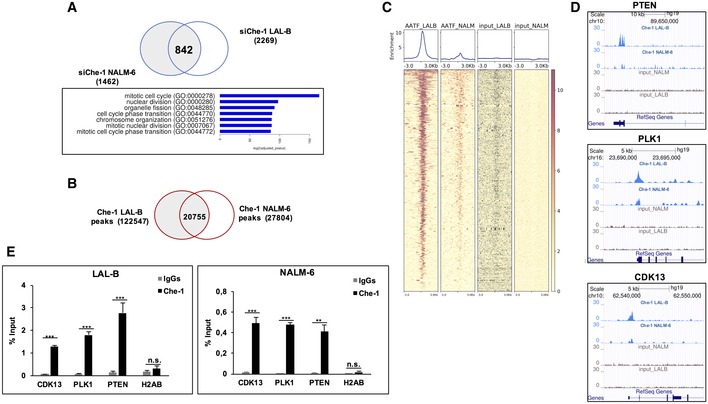
Figure 3. Che‐1 regulates transcription and strongly cooperates with the transcriptional machinery on chromatin of B‐ALL cells.

- Intersection of spike‐in‐normalized differential expressed genes in LAL‐B and NALM‐6 cell lines. The 842 genes downregulated in both cell lines show a strong enrichment in several functional clusters.
- Venn diagram of Che‐1 peak sets in LAL‐B and NALM‐6 cell lines computed by bedtools intersect.
- ChIP‐seq signal, centered on 2,205 TSS sites extracted from the 842 RNA‐seq downregulated signature. The Deeptools Heatmap plot shows an enrichment of Che‐1 position with respect to both inputs.
- Genome Browser Screenshots of ChIP‐seq bigWig signal on cell‐cycle‐related genes promoters.
- Quantitative ChIP analysis (ChIP–qPCR) of Che‐1 enrichment on CDK13, PLK1, and PTEN promoters in NALM‐6 and LAL‐B cells. H2AB (Histone Cluster 2 H2A Family Member B) was used as negative control. Data are expressed as percent of input. Error bars represent the standard error of three different experiments. **P ≤ 0.01; ***P ≤ 0.001 by Student's t‐test.
