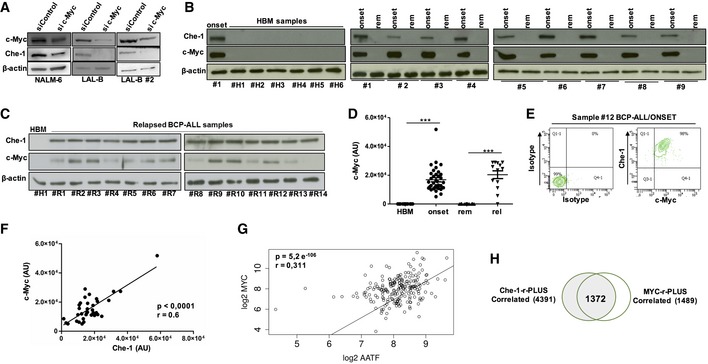
Figure 5. Che‐1 and c‐Myc strictly cooperate to sustain BCP‐ALL cell growth.

- WB analysis of Che‐1 expression in c‐Myc‐interfered NALM‐6, LAL‐B, and LAL‐B#2 cell lines.
- Evaluation of c‐Myc expression by WB in six representative samples of HBM and in nine BM samples of BCP‐ALL analyzed at time of diagnosis (onset) and at time of remission (rem). β‐actin was used as loading control. #1 BCP‐ALL sample was used as positive control.
- WB analysis for c‐Myc expression in BMs from relapsing patients (#R1–#R14). β‐actin was used as loading control. #H1 sample was used as negative control.
- c‐Myc distribution in HBM samples (15), BCP‐ALL samples collected at diagnosis (35), at remission (28), and at time of relapse (13). ***P ≤ 0.001 by Mann‐Whitney U‐test.
- FACS analysis of c‐Myc and Che‐1 co‐expression in a BCP‐ALL sample collected at diagnosis (#12).
- Che‐1/c‐Myc correlation in 35 BCP‐ALL samples analyzed.
- Scatter plot of Che‐1 and c‐Myc expression levels in Murphy's 207 BCP‐ALL patient's dataset. The two transcripts show a significant (P‐value = 5.2e‐06) positive (R: 0.31) correlation.
- Venn diagram for the Che‐1‐r‐Plus and c‐Myc‐r‐Plus sets.
Source data are available online for this figure.
