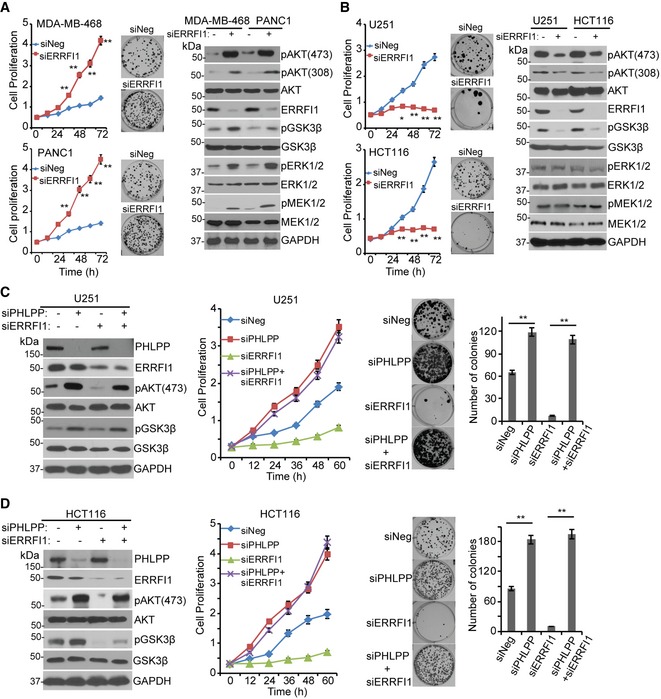
Figure 7. The effect of ERRFI1 on AKT activation and cell proliferation depends on the basal EGFR level.

-
A, BKnockdown of ERRFI1 increased proliferation and colony formation in MDA‐MB‐468 and PANC1, two EGFR‐high cells (A). Knockdown of ERRFI1 decreased proliferation and colony formation in U251 and HCT116 EGFR‐low cells (B). Cell proliferation was monitored every 12 h. The x‐axis indicates time post‐treatment, and the y‐axis indicates cell proliferation rate. The representative colony formation pictures from triplicate experiments are shown. Error bars represent ± SEM of three independent experiments; *P < 0.05, **P < 0.01 compared to siNeg. Statistical analyses were performed with Student's t‐test. Remaining cells were blotted with the indicated antibodies.
-
C, DU251 and HCT116 cells were transfected with indicated siRNA. Cell lysates were blotted with the indicated antibodies. Cell proliferation and colony formation were assessed. Quantification of colony formation is shown. Error bars represent ± SEM of three independent experiments. **P < 0.01. Statistical analyses were performed with Student's t‐test.
Source data are available online for this figure.
