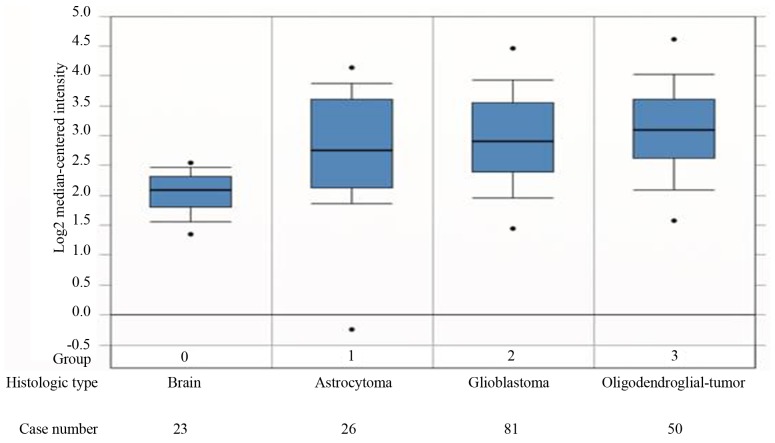
Figure 1.
Melanoma-associated antigen-D4 mRNA upregulation in gliomas, including astrocytoma, glioblastoma and oligodendroglia, compared with normal brain tissues, according to the Sun Brain 2 dataset. The figure was generated using ONCOMINE (https://www.oncomine.org/). The 25th, 50th and 75th percentile values are depicted as horizontal lines; the 10th and 90th percentile values are depicted as whiskers; and the maximum and minimum values are depicted as dots.

