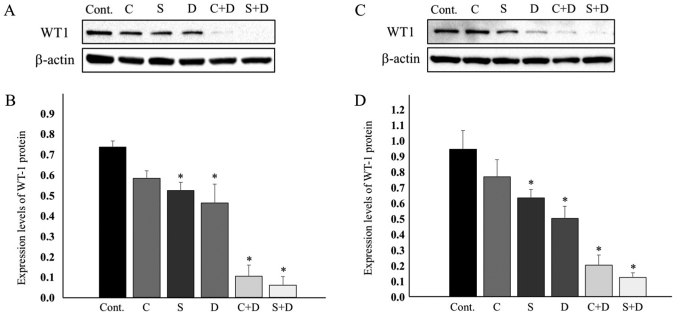
Figure 4.
WT1 protein expression and quantification in (A and B) HCT116 cells and (C and D) HT29 cells. (B) and (D) Quantification was performed by normalization to β-actin. The DAC concentration used was 31.25 nM for HCT116 and 75 nM for HT29. Data are expressed as mean ± standard deviation. *P<0.05 (one-way analysis of variance followed by Dunnett's test). WT1, Wilms' tumor protein; DAC, 5-aza-2′-deoxycytidine; CPT-11, irinotecan; SN-38, 7-ethyl-10-hydroxycamptothecin; Cont., vehicle control; C, 0.5 µM CPT-11; S, 1.0 nM SN-38; D, 31.25 for HCT116 cells; Fig. 4B. or 75 nM for HT29 cells; Fig. 4D. DAC.

