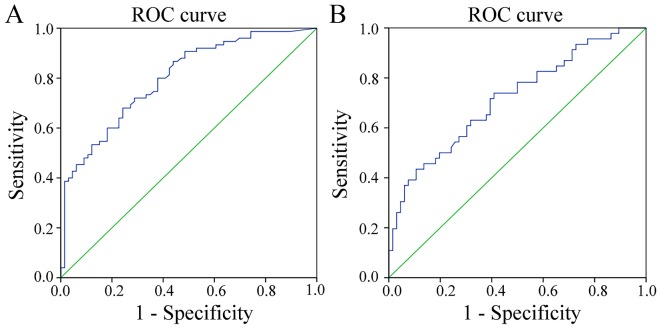
Figure 4.
ROC curves of the diagnostic threshold of quantitative methylation of (A) paired box gene 1 and (B) LIM homeobox transcription factor 1 α in the exfoliated cells. high-grade squamous intraepithelial lesion vs. low-grade squamous intraepithelial lesion+negative control. ROC, receiver operating characteristic.

