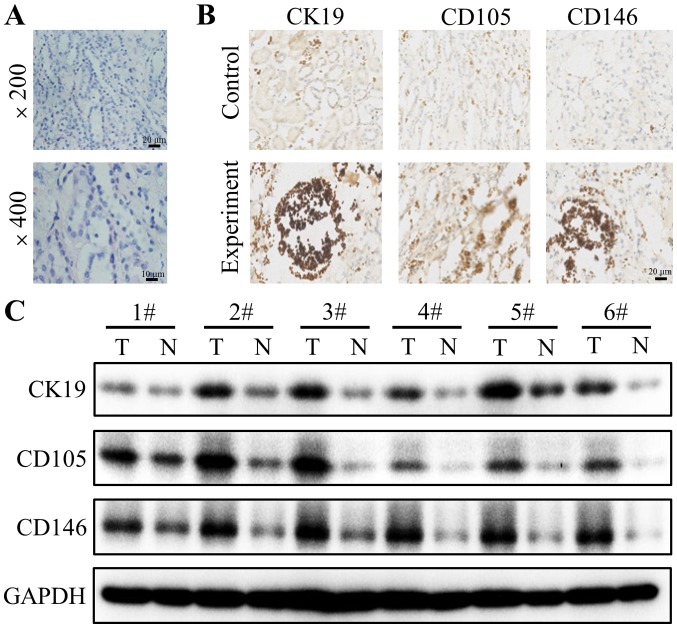
Figure 1.
CK19, CD105 and CD146 expression in renal cell carcinoma tissues. (A) Representative tumor samples with hematoxylin-eosin staining. (B) Representative sections of CK19, CD105 and CD146 in tumor tissues compared with adjacent normal tissues, which were detected using immunohistochemical staining. (C) Representative blots extracted from tumor tissues and normal tissues were subjected to western blotting for CK19, CD105 and CD146. GAPDH was used as a loading control. Each number corresponds to a different patient. Representative blots of three experiments are shown. CK19, cytokeratin 19; CD105, endoglin; CD146, cluster of differentiation 146.

