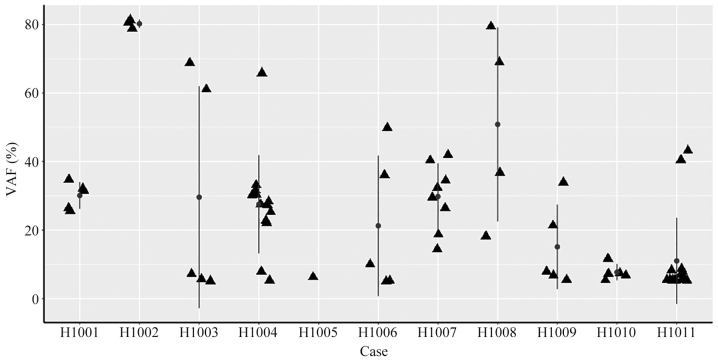
Figure 5.
Summary of VAF in 11 tumor cases. Scatter plots of the VAF in tumor tissues from 11 patients with colorectal cancer. The VAF values are indicated in the y-axis, and the patient ID is shown in the x-axis. The vertical line with dots represent the mean ± standard deviation of VAF. VAF, variant allele fraction.

