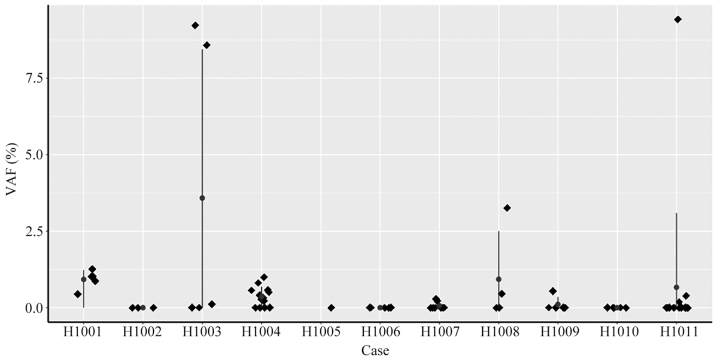
Figure 6.
VAF in pre-operative plasma from 11 patients with CRC. Scatter plots of VAF in ctDNA of pre-operative plasma from 11 patients with CRC. The patient ID is presented on the x-axis, and the VAF is indicated on the y-axis. The vertical line with dots represent the mean ± standard deviation of the VAF. CRC, colorectal cancer; VAF, variant allele fraction.

