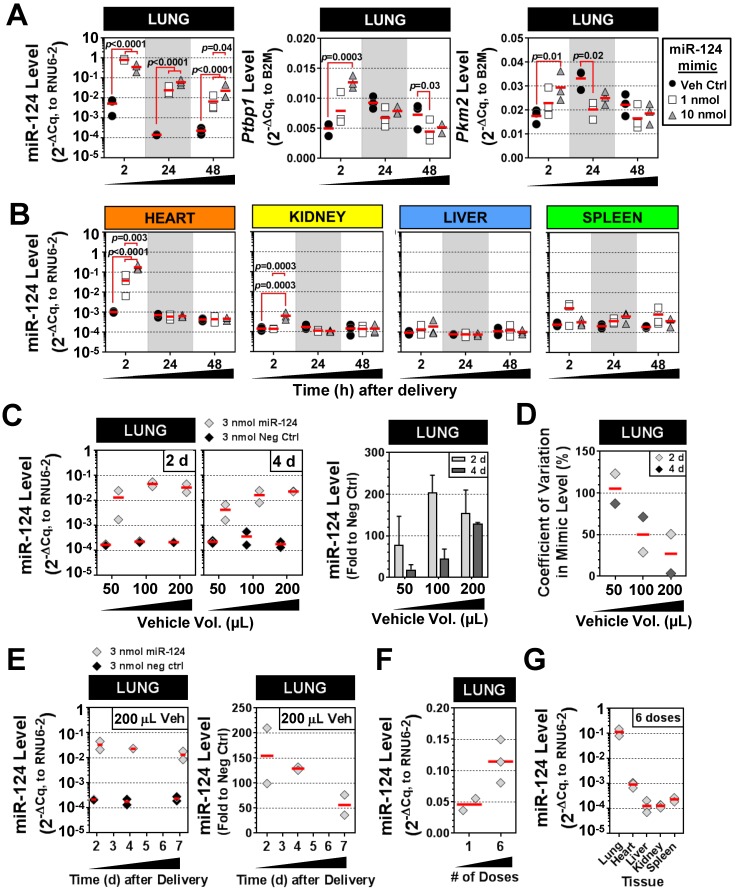
Figure 6.
Characterization of IT-L mimic delivery with an endogenous mammalian miRNA. (A) Pulmonary levels of miR-124 and transcript levels of two known targets (Ptbp1 and Pkm2) after IT-L mimic delivery. Rats received either vehicle alone (8% invivofectamine in PBS; 50 µL total volume.), or vehicle complexed with 1 nmol or 10 nmol of miR-124 mimic. P values were determined by Two-way ANOVA and Tukey's multiple comparisons test on log transformed data (n=3 rats/treatment/time point). (B) Non-pulmonary tissue biodistribution of miR-124 after IT-L mimic delivery. Rats received either vehicle alone (8% invivofectamine in PBS; 50 µL total volume.), or vehicle complexed with 1 nmol or 10 nmol of miR-124 mimic. (C) Effects of increasing vehicle volume on miR-124 lung levels. A fixed quantity of miR-124 mimic or negative control mimic (3 nmol/rat) was administered with increasing vehicle volumes (8% invivofectamine in PBS proportionally scaled up), and rats were evaluated 2 and 4 days after delivery. Left panels show relative normalized levels of miR-124, while the right panel shows miR-124 expressed as the fold change to the negative control mimic group (n=2 rats/vehicle volume/time point). Bar chart shows mean and range. (D) Coefficient of variation in lung mimic levels assessed in part C (standard deviation/mean of 2 biological replicates) as a function of vehicle volume. Data are shown for 2 and 4 days post delivery. (E) Persistence of miR-124 lung levels up to 7 days post delivery. Left panels show the relative normalized level of miR-124, while the right panel shows corresponding miR-124 data expressed as the fold change to the negative control group (n=2 rats/treatment/time point). (F) Comparison of miR-124 lung levels after 1 versus 6 doses of mimic. Three nmol of miR-124 mimic (in 100 µL total vehicle volume) was given once or six times (3 doses/week for 2 weeks), and evaluated 48 h after the last dose. (G) Tissue biodistribution of miR-124 assessed 48 h after the last of the 6 mimic doses (n=3 rats). Individual biological replicates are shown with mean level denoted by red horizontal lines. No statistical tests were performed on groups with sample sizes of n<3.

