Figure 4.
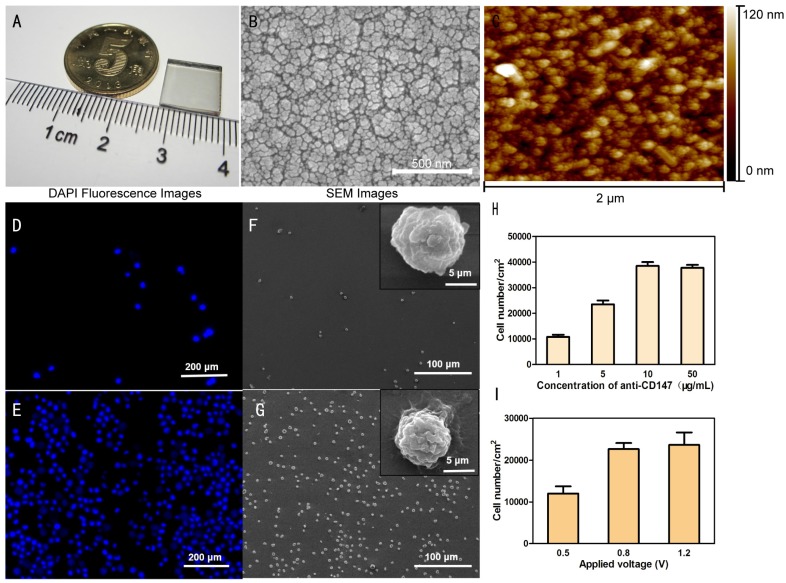
Microchip characterization. (A) Photograph showing the biotin-doped Ppy nanostructure microchip. Typical SEM image (B) and AFM image (C) showing 3D nanostructures formed by biotin-doped Ppy nanoparticles on the ITO substrate. (D-G) Representative fluorescence images and SEM images of the flat ITO microchip and the biotin-doped Ppy microchip on which NRBCs were captured. The biotin-doped Ppy microchip exhibited considerably better cell capture efficiency than the flat ITO microchip due to its high volume ratio. (H) Comparison of the cell numbers on the nanostructure microchips using different concentrations of anti-CD147 applied for cell capture. (I) Comparison of the cell numbers on the microchips after applying different voltages for electroplating Ppy and biotin.

