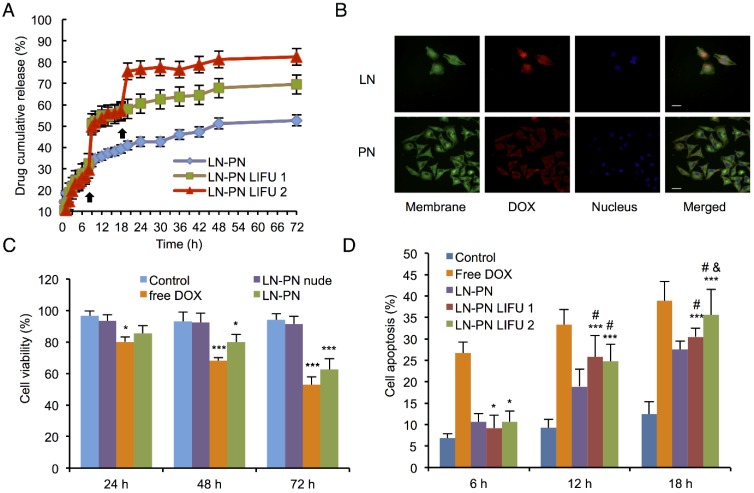
Figure 3.
A) Drug-releasing profiles triggered by LIFU under different conditions (black arrow: ultrasound administration); B) Cell uptake observed by confocal fluorescent microscopy (Dio: green, DOX: red, DAPI: blue). Scale bar=10 μm; C) Cell viability of various therapeutic agents (*p<0.05 vs the control group; ***p<0.001 vs the control group; #p<0.05 vs the LN-PN group; p<0.05 vs the LN-PN LIFU1 group; n=3); D) Cell apoptosis in different groups by LIFU treatment.

