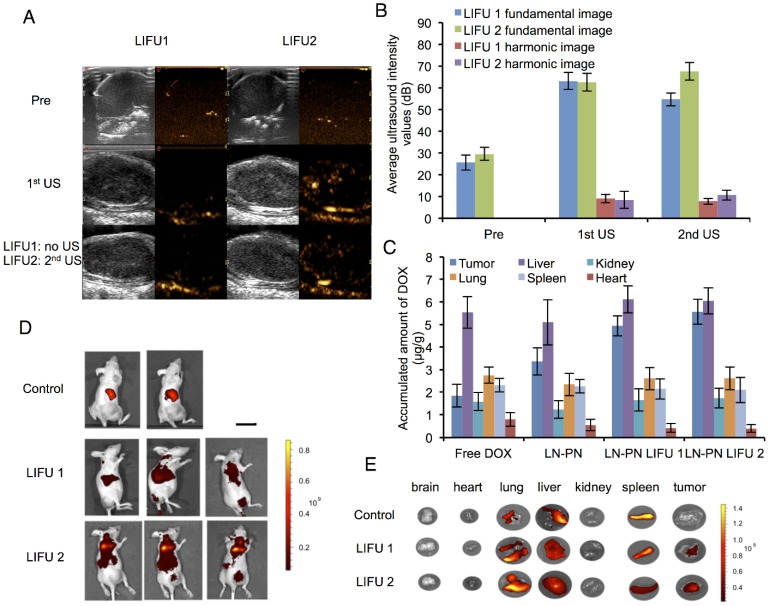
Figure 4.
Ultrasound images (A) and average ultrasound intensity values (B) in tumors. Scale bar=0.3 cm. (C) in vivo distribution of accumulated DOX per gram tissue after intravenous injection of different formulations for 24 h. Distribution of nanodroplets labeled by DiR in vivo (D) and in different organs (E) (Control: no ultrasound radiation; 1: before ultrasound exposure; 2: the1st treatment; 3: the 2nd treatment) Scale bar=2.5 cm.

