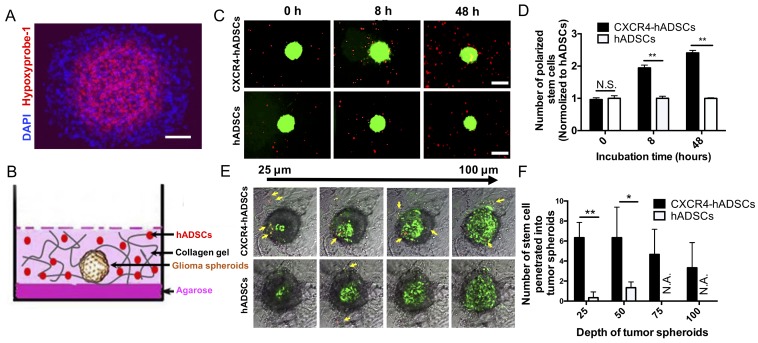
Figure 3.
hADSCs respond to hypoxia in 3D tumor spheroids and penetrate into solid tumor spheroids. (A) Tumor spheroids comprise a normoxic outer shell, surrounding a hypoxic core. Hypoxia immuno-staining of 3D multicellular glioma spheroids using Hypoxyprobe-1 kit. Blue: Nucleus stained by DAPI. Red: Hypoxic region stained by hypoxyprobe-1 kit (pimonidazole). Scale bar=100 μm. (B) The schematic drawing shows a spheroid and hADSCs 3D co-culture model that mimicks tumor extracellular matrix (ECM). (C) CXCR4-hADSCs showed the faster response and migrated towards tumor spheroids over 48 h, while hADSCs showed a moderate level of tropism towards tumor spheroid. Scale bar=600 μm. (D) Quantification of hADSCs polarized to tumor spheroids. **p<0.01; N.S., non-significant. (E) Penetration of hADSCs into solid tumor spheroids. Confocal images of glioma spheroids after 48 h migration showed some of the red cells penetrated inside the glioma spheroid and accessed the hypoxic cells inside the spheroids. Z-stack images were obtained starting at the top of the spheroid in 25 μm intervals for a total of 100 μm into the spheroid. Red: PKH 26-labeled migrating cells. Green: GFP-positive tumor cells (U87MG). Gray: Bright field of collagen matrix. Yellow arrow indicates the migrated cells. Scale bar = 300 μm. (F) Quantification of hADSCs penetrated into tumor spheroids. *p<0.05; **p<0.01; N.S., no significant difference; N.A., not available.

