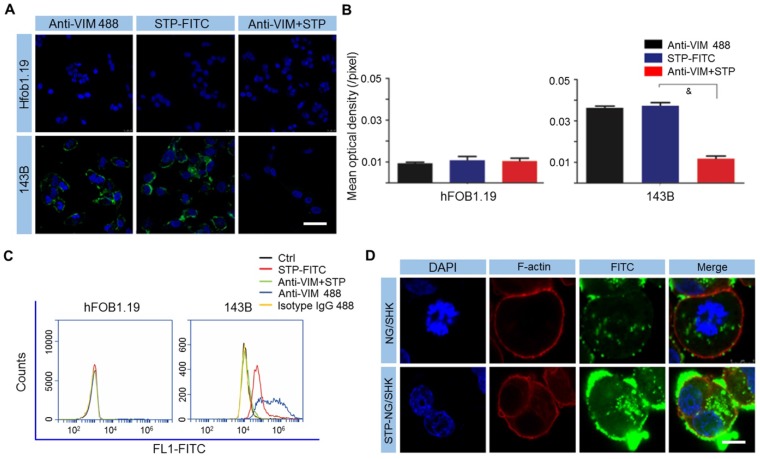
Figure 2.
STP binds to osteosarcoma cells by CSV. (A) Cell-surface staining analysis for CSV in hFOB1.19 osteoblasts and 143B cells with CLSM. Scale bar = 25 μm. (B) Cells were stained with Anti-VIM conjugate 488 (green), STP-FITC (green), or Anti-VIM+ STP-FITC (green), and mean optical density (/pixel) was measured. Nuclei were stained with Hoechst 33342 (blue). Scale bar = 10 mm. (C) Immunologic assessment of STP binding to hFOB1.19 and 143B cells with FCM. Anti-VIM conjugate 488 was a positive control. Isotype controls were negative controls. Each set of data is represented as mean ± SEM (n = 3; &P < 0.001). (D) 143B cells were incubated with NG/SHK-FITC and STP-NG/SHK-FITC, and cellular uptake was measured by fluorecence imaging. Scale bar = 5 μm.

