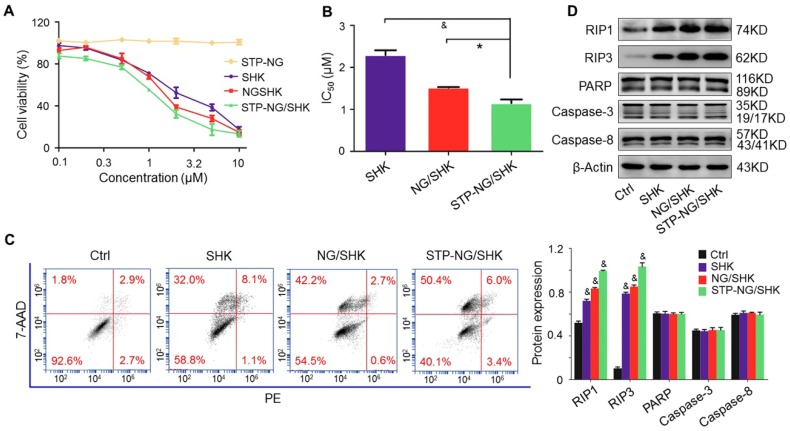
Figure 3.
Cytotoxicity in vitro. (A) The cell viability of 143B cells was detected. (B) IC50s of SHK, NG/SHK, and STP-NG/SHK after 24 h. (C) Necroptosis in osteosarcoma 143B cells measured by FCM and Annexin V/7-AAD staining after treatments. Panel quadrants indicate populations of normal, early and late apoptotic, and necrotic cells. (D) RIP1, RIP3, PARP, caspase-3, and caspase-8 measurement via Western blot and (E) semiquantitative analyses. Each set of data is represented as mean ± SEM (n = 3; *P < 0.05, #P < 0.01, &P < 0.001).

