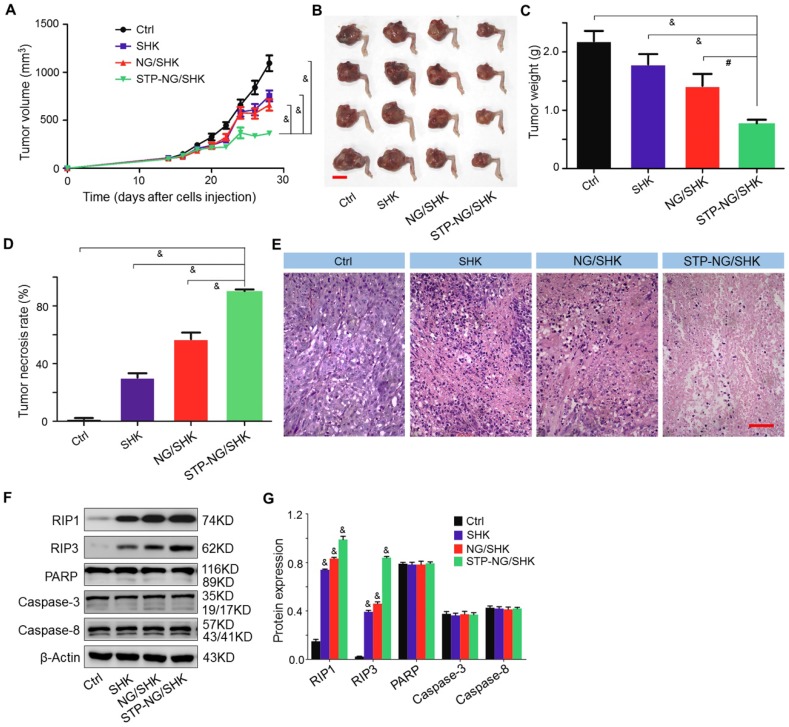
Figure 5.
In vivo antitumor efficacy of STP-NG/SHK against primary osteosarcoma. (A) Tumor growth curves. (B) Posterior limb tumors. (C) Average weight of tibial primary osteosarcoma tumors. (D) Tumor necrosis calculated with NIS-Elements imaging software. (E) H&E of primary tumor. Scale bar = 100 μm. (F) RIP1, RIP3, PARP, caspase-3, and caspase-8 expression in primary tumor tissues per group measured with Western blot and (G) semiquantitative analyses. Each set of data is represented as mean ± SEM (for A, C and D, n = 7, for G n=3; #P < 0.01, &P < 0.001).

