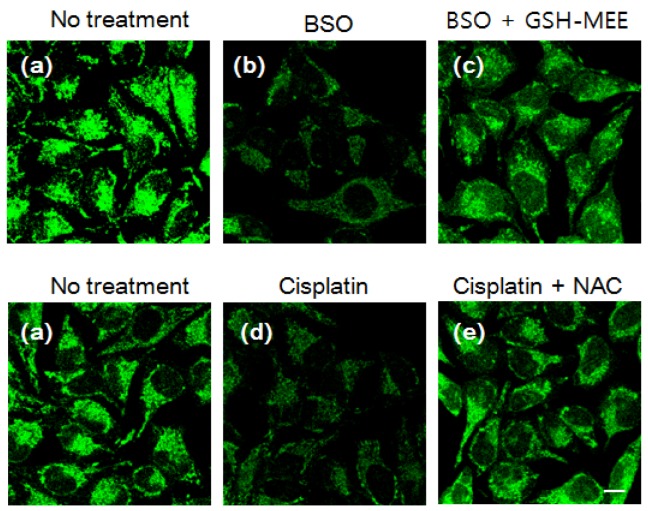
Figure 4.
Changes in the intracellular GSH level after drug treatment. HeLa cells were incubated with (a) no treatment; (b) 100 µM BSO for 6 h; (c) 100 µM BSO with 1 mM GSH-MEE for 6 h; (d) 50 µM cisplatin for 6 h; (e) 50 µM cisplatin with 2 mM NAC for 6 h. Cells were then stained with 3 µM MNDA for 30 min and imaged withex. 473 nm/em. 490-590 nm. Scale bar: 10 µm.

