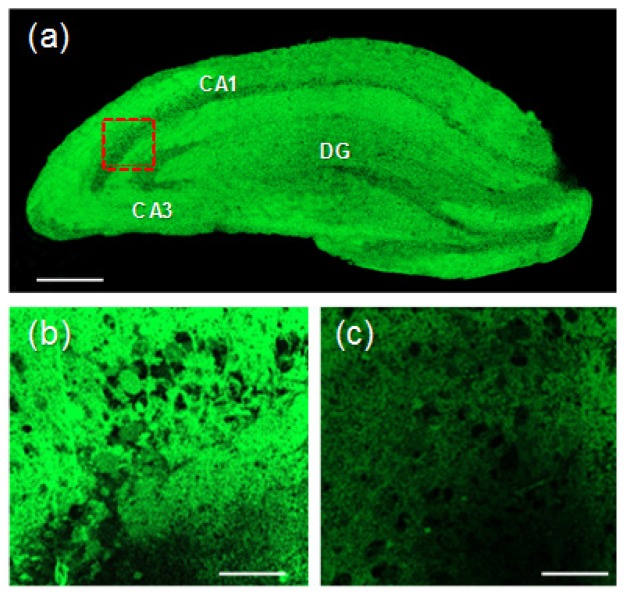
Figure 6.
(a) Accumulated TPM images of a fresh rat hippocampal slice stained with 50 μM MNDA at a depth of 90-180μm with a magnification of 10×. Scale bar: 300 μm. (b) TPM image in the CA1 region (red box) at a depth of ~100 μm with amagnification of100×. Scale bar: 30 μm. (c) TPM image of (b) pretreated with NMM (200 μM) before labelling with 20 μM MNDA. The TPEF were collected at 400-600 nm upon excitation at 900 nm with fs pulse.

