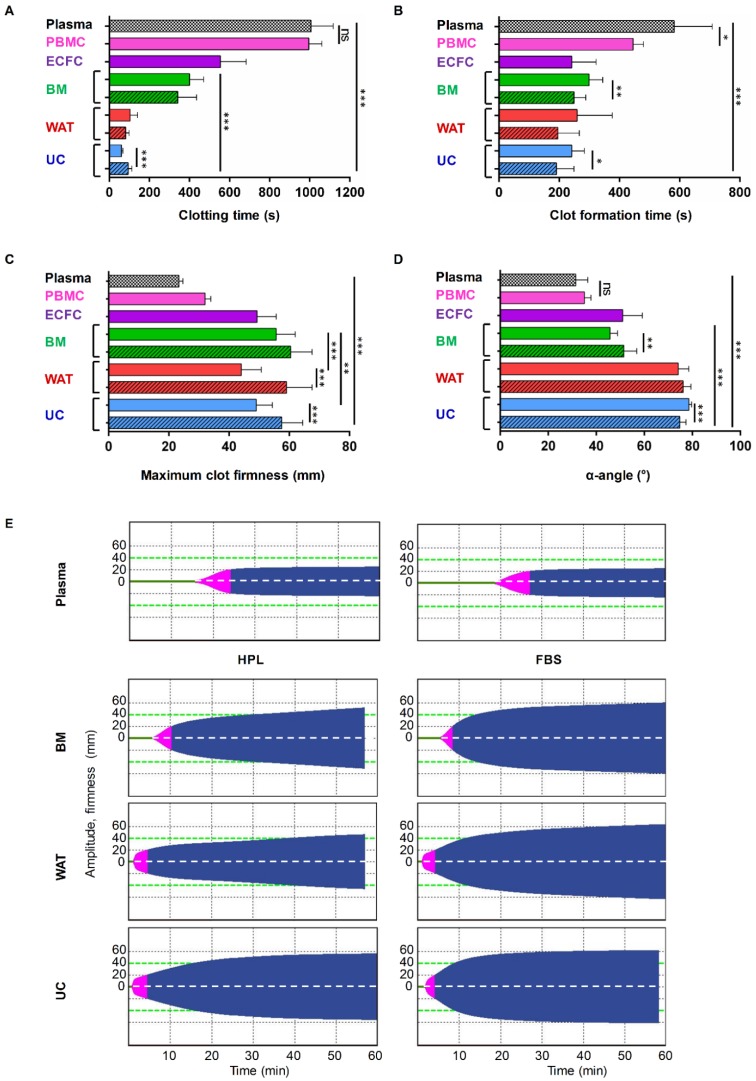
Figure 2.
Comparison of coagulation activity of different cell types. All data shown are mean ± SD values of (A) clotting time, (B) clot formation time, (C) maximum clot firmness and (D) α-angle of test plasma clotting induced by adding one million cells per 300 µL from five donors (ECFCs, BM-, WAT- and UC-stromal cells) measured in triplicate or three donors (PBMCs) compared to cell-free human blood group AB plasma. Color code as in Figure 1C-D; cells cultured in FBS medium are displayed as hatched bars (PBMCs in light and ECFCs in darker purple). Significant differences as indicated (in A-D, *p < 0.05; **p < 0.01; ***p < 0.001, one-way ANOVA with Tukey's multiple comparisons test and unpaired t-test). (E) Representative thromboelastometry curves after adding one million stromal cells from BM-, WAT- and UC-derived stromal cells cultured in HPL- or FBS-supplemented media compared to cell-free human blood group AB plasma, as indicated. Clot formation time is marked in violet. For a detailed description of thromboelastometry parameters see Figure S6.

