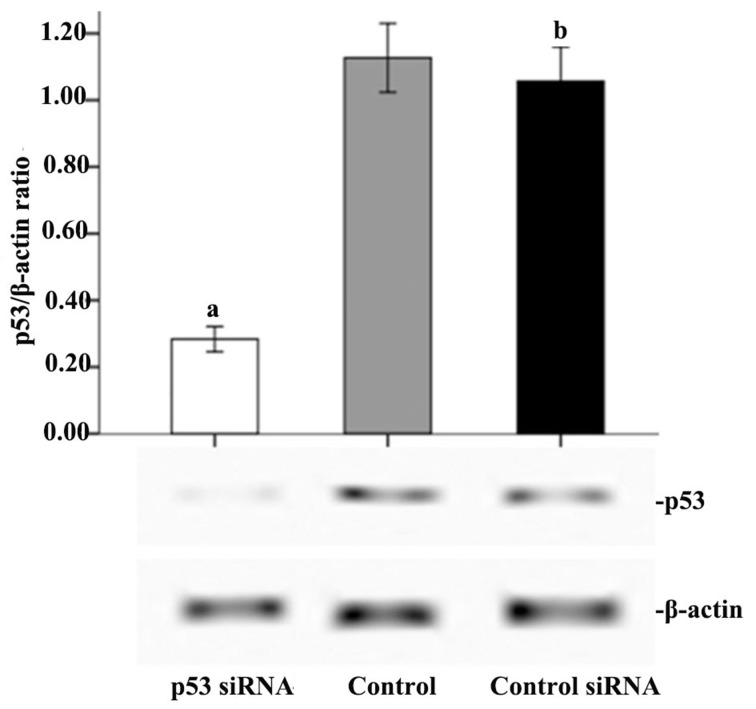
Figure 6.
Effect of p53 siRNA on p53 expression in A549 cells. A549 cells were transfected with p53 siRNA, scrambled siRNA (control siRNA), or left untransfected (control). At 24 h following transfection, western blot analyses were performed to examine the inhibition efficiency. The graph presents data as the mean ± standard deviation from three independent determinations of optical density of the p53 western blot bands. aP<0.05 compared with control. bNot statistically different (P>0.05) compared with control. p53, cellular tumor antigen p53; si, small interfering.

