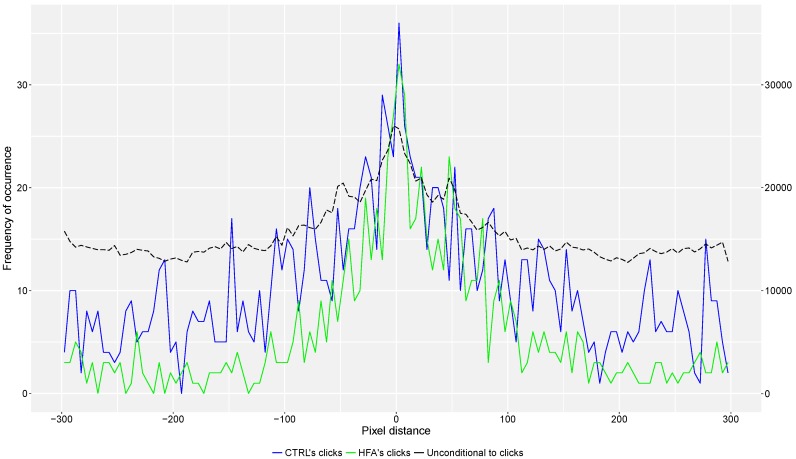
Figure 3.
Distances between own and other’s avatar. The frequency distribution of the distances in pixels between the two participants’ avatars is shown. The different colors referred to the overall unconditional to clicks distances, and to those from each group at the time of clicking (4-pixel bins, as objects are 4 pixels wide).

