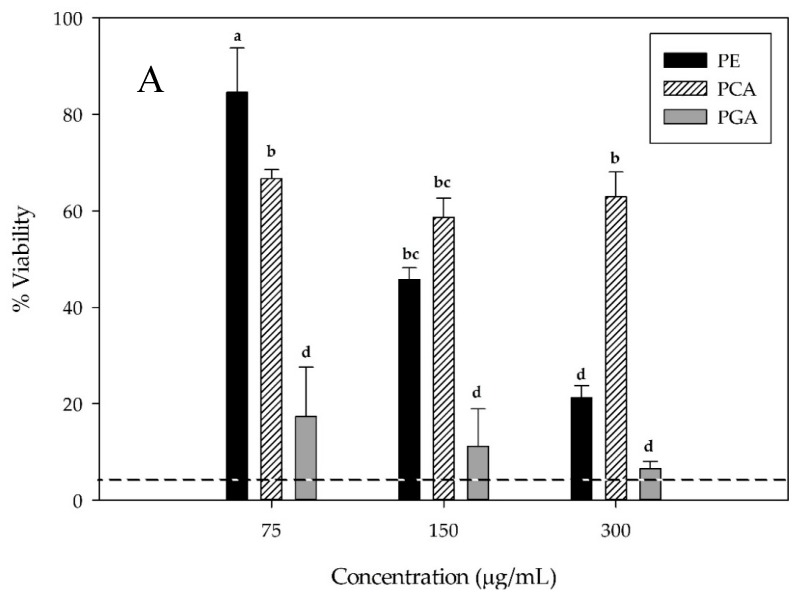
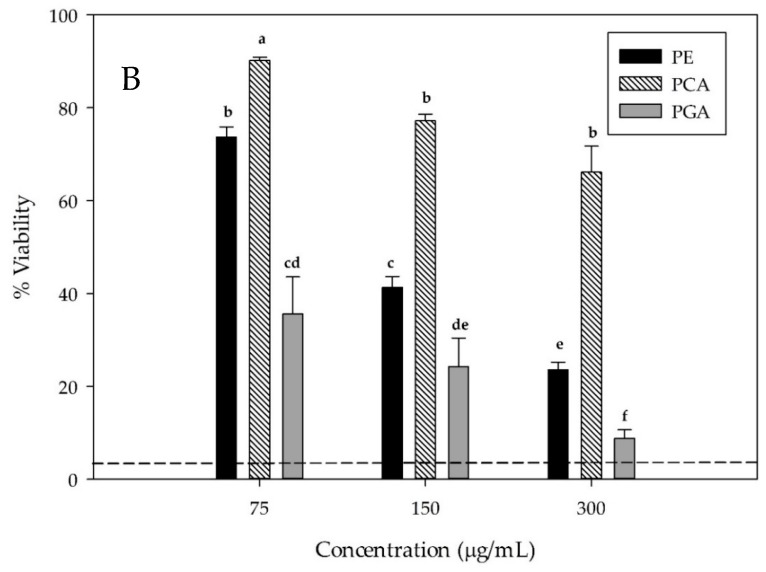
Figure 3.
Cellular viability (% relative to the control) as determined by an acid phosphatase assay (A) and ATP content (B) of HepG2 cells incubated with C3G-rich fraction (PE), PCA, and PGA for 48 h. Dashed line represents positive control sorafenib at a concentration of 10 µg/mL. Letters (a–f) on the bars indicate significantly different means (p ≤ 0.05). PE, C3G-rich fraction; PCA, protocatechuic acid; PGA, phloroglucinaldehyde.


