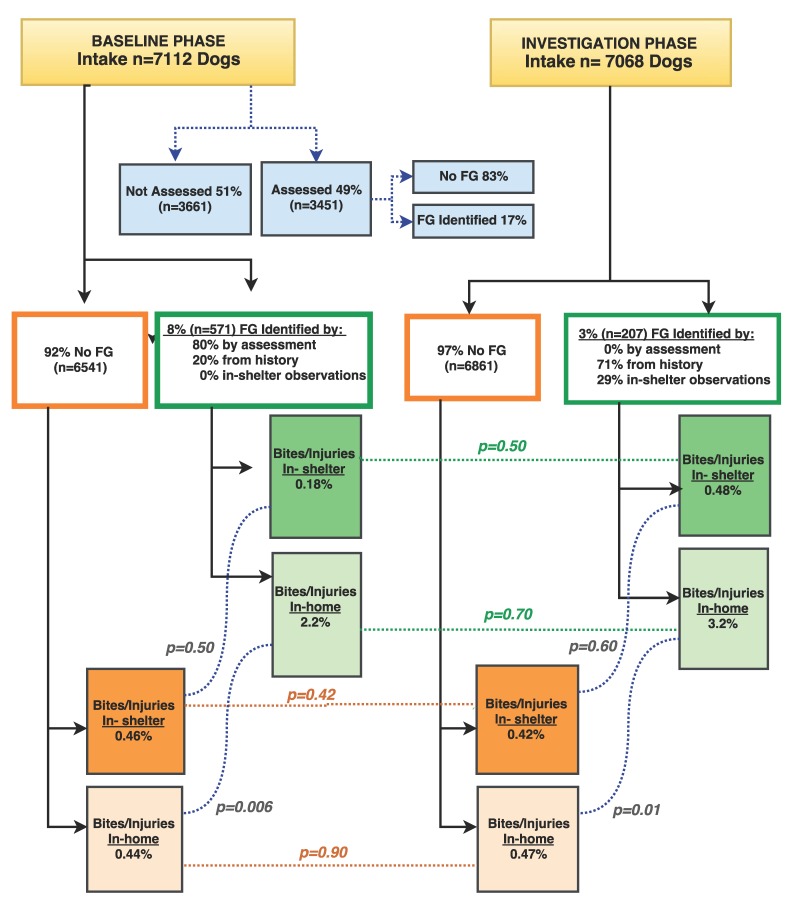
Figure 1.
Total intake of dogs between the two study phases: percentage of dogs who were assessed, those dogs identified with food guarding behavior, and incidence of injury/bites in each phase. Non-FG groups are in orange and food guarding (FG) groups in green, with corresponding p-values displayed between the baseline and investigative phases. In baseline phase, there are blue boxes and dotted lines that show the percentage of dogs that had the standardized shelter assessment and of those assessed, how many were identified with FG. This was added so the reader can visualize the large percentage of dogs that did not have a standardize assessment performed and to clarify the two ways a shelter can arrive at incidence of FG (17% is only of those assessed while 8% is all intake).

