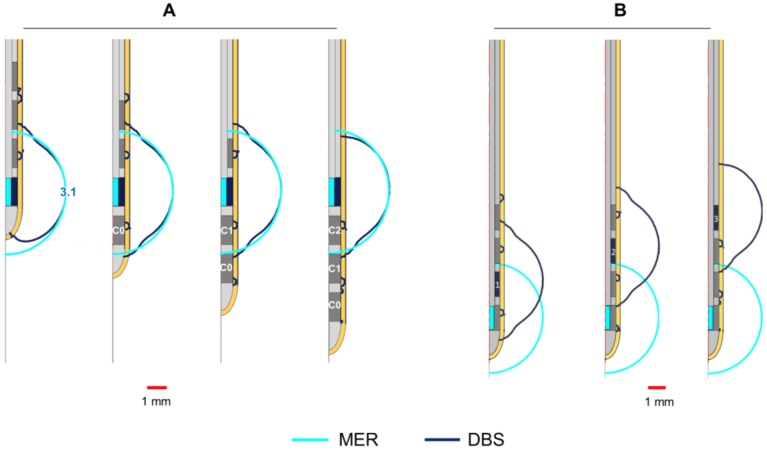
Figure 4.
Influence of non-active contacts for DBS. EF simulated in homogeneous grey matter (0.123 S/m) depicted with 0.2 V/mm isocontours. (A) Activation of each DBS contact displacing the DBS lead to align the middle point of the active contact (dark blue) to that of the MER stimulation contact (cyan). Numbers in front of the active contact of the first lead indicate the maximal EF extension measured from the lead’s axis. (B) Activation of each DBS contact while the first contact (C0) is aligned to the middle point of the MER stimulation contact. The DBS contacts were set to 3 V one at the time and the MER stimulation contact was set to 3 mA. Non-active contacts (in dark grey) were set to floating potential. Maximal extension obtained for the MER and DBS contacts: 3.1 mm.

