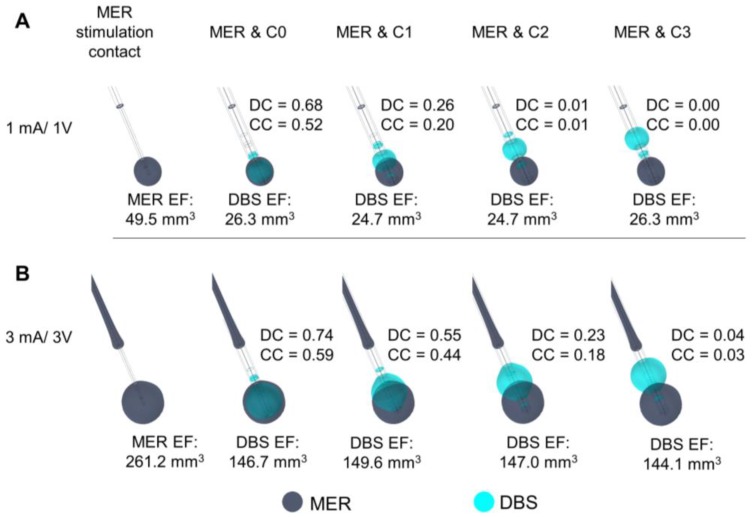
Figure 5.
Comparison of the EF between the MER stimulation contact and each DBS contact simulated in a heterogeneous medium (σ ≈ 0.079 S/m). DBS first contact (C0) (cyan) aligned to match the middle point of the MER stimulation contact (dark blue). EF isosurfaces (0.2 V/mm) superimposed for (A) MER stimulation contact set to 1 mA and the active DBS contact set to 1 V, and (B) for 3 mA and 3 V. EF volume within the selected isosurface shown below the lead and Dice coefficient (DC) and coverage coefficient (CC) shown to the right of each lead.

