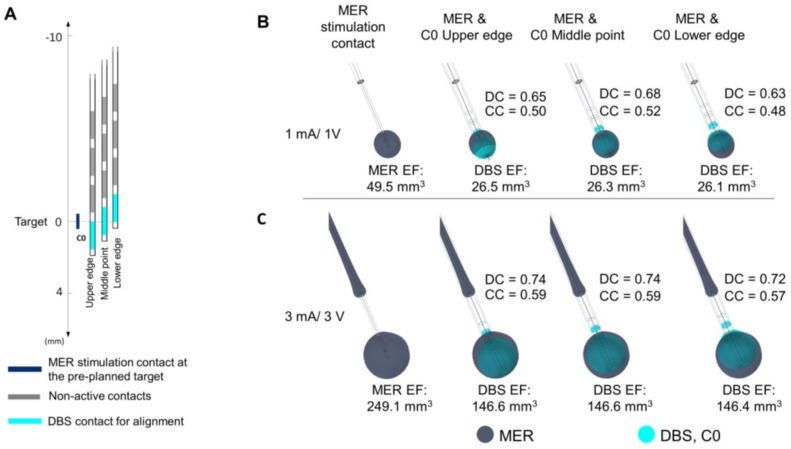
Figure 6.
Evaluation of the position of the DBS contact in heterogeneous tissue (σ ≈ 0.079 S/m). (A) Displacement of the DBS lead to match the lower edge, the middle point, and the upper edge to the middle point of the MER stimulation contact localized at the target. Overlay of the EF isosurfaces (0.2 V/mm) simulated for the MER stimulation contact (dark blue) and the DBS first contact C0 (cyan) set to (B) 1 mA and 1 V and (C) 3 mA and 3 V, respectively. EF volume within the selected isosurface shown below the lead. DC and CC shown to the right of each lead.

