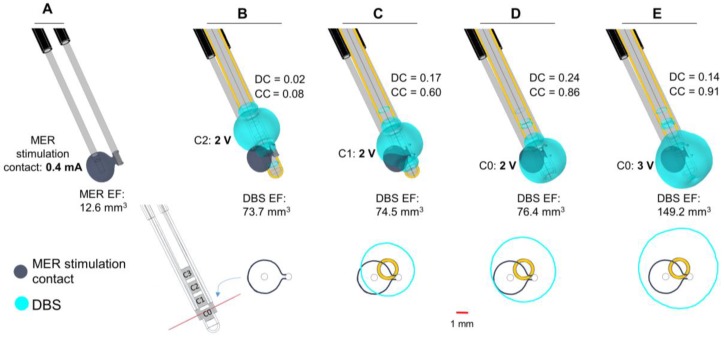
Figure 7.
Clinical case. Electric field distribution depicted with 0.2 V/mm isosurfaces (upper panel) and isocontours (lower panel) obtained at the perpendicular plane placed at the middle point of the MER stimulation contact (red line). MER and DBS lead trajectories obtained from the preoperative plan and the postoperative CT scan, respectively. (A) Stimulation tests performed with the MER stimulation electrode placed at the optimal position determined intraoperatively: 2 mm beyond the pre-planned target on the central trajectory with a stimulation amplitude of 0.4 mA. (B) Overlap of the EF obtained with the MER stimulation electrode (dark blue) and the DBS contact C2 (cyan) set to 2 V, programmed six months after surgery. DBS lead placed 3 mm beyond the target (lower edge of the first contact, C0); (C,D) Additional comparisons using DBS contacts C1 and C0 set to 2 V and (E) C0 set to 3 V. EF volume within the selected isosurface shown below each lead. DC and CC shown to the right of each case.

