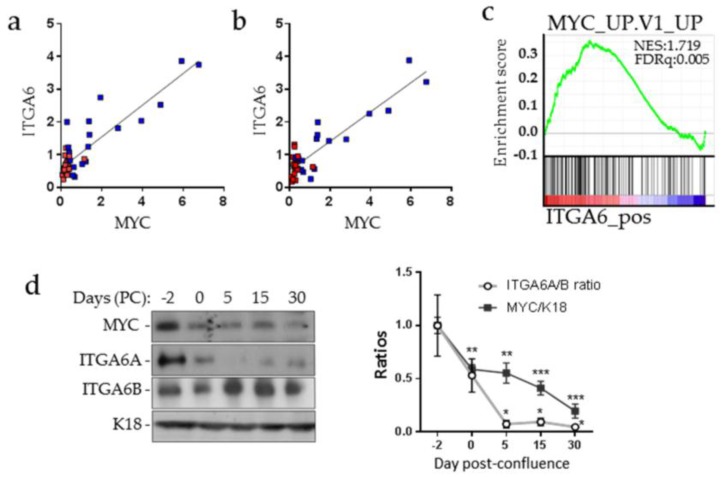
Figure 1.
Integrin α6A (ITGA6A) and MYC expression correlation in colorectal cancer cells. Correlation between ITGA6 (a) and ITGA6A (b) with MYC transcript expression was assessed in 20 primary colorectal cancer tumors (blue squares) and their resection margins (red squares). Pearson r = 0.8802; p ≤ 0.0001 (ITGA6A vs. MYC); Pearson r = 0.8933; p ≤ 0.0001 (ITGA6 vs. MYC).(c) Positive correlation observed on a gene set enrichment analysis GSEA plot of enrichment of MYC upregulated genes in high ITGA6 expression specimens from the human colorectal cancer data set (GSE35896) using C2 MSigDB database.(d) Representative Western blot analysis of ITGA6A, ITGA6B and MYC expression in Caco-2/15 cells in sub-confluent (−2 days), confluent (0 day) and post-confluent (5–30 days) monolayers and quantification of ITAG6A/ITGA6B and MYC/K18 ratios through the confluence. Cytokeratin 18 (K18) was used as a loading control. Statistically significantly different from -2 days post-confluence: * p ≤ 0.05; ** p ≤ 0.01; *** p ≤ 0.001. Pearson r = 0.9005 p ≤ 0.05 for ITGA6A/ITGA6B ratios vs. MYC/K18.

