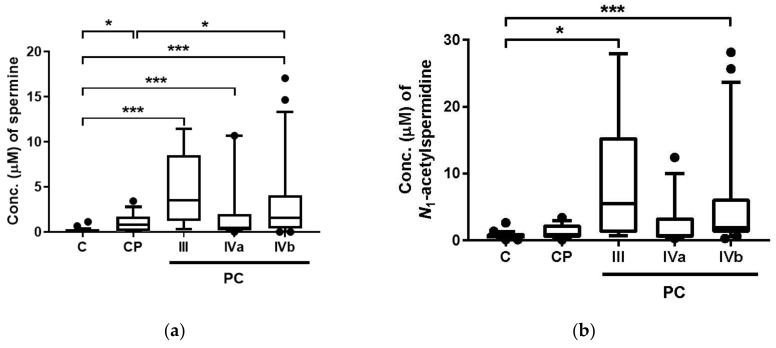
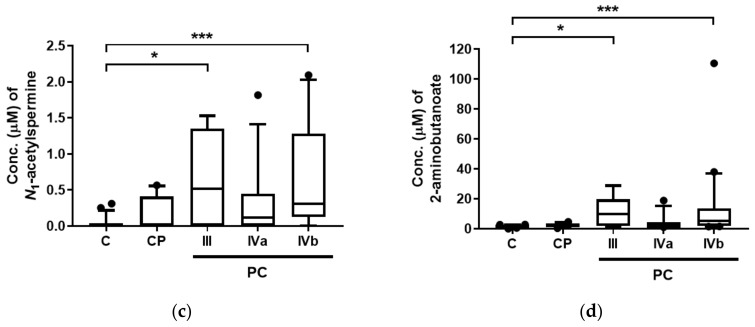
Figure 2.
Salivary concentration of four metabolites showing significant difference among control patients (C), chronic pancreatitis patients (CP), and pancreatic cancer patients (PC): (a) spermine; (b) N1-acetylspermidine; (c) N1-acetylspermine; (d) 2-aminobutanoate (2AB). III, IVa, and IVb indicate the stage of PC. The number of subjects for C, CP, and PC Stages III, IVa, IVb were 26, 14, 6, 12, and 21, respectively. Horizontal bars of box-whisker plots indicate 10%, 90%, median, and lower and upper quantiles. The data <10% and >90% were depicted as plots. *** p <0.001 and * p < 0.05 by the Steel–Dwass test.


