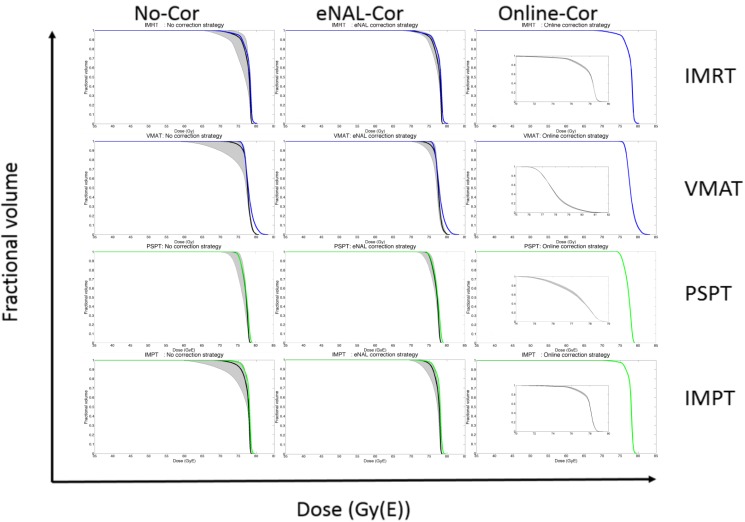
Figure 3.
CTV-DVH data for an example patient for IMRT, VMAT, PSPT and IMPT with and without correction: The colored lines represent the planned treatment (blue X-EBRT, green P-EBRT). The solid black lines represent the median treatment delivered and is related to robustness which denotes the likelihood of delivering the planned dose. The shaded grey regions depict the 95% confidence intervals and are related to stability which denotes the possible range of the dose delivered. The distribution of possible treatments is asymmetric. The small figures inside the right column of the figure is a magnification of the dose-drop-off region of the DVH.

