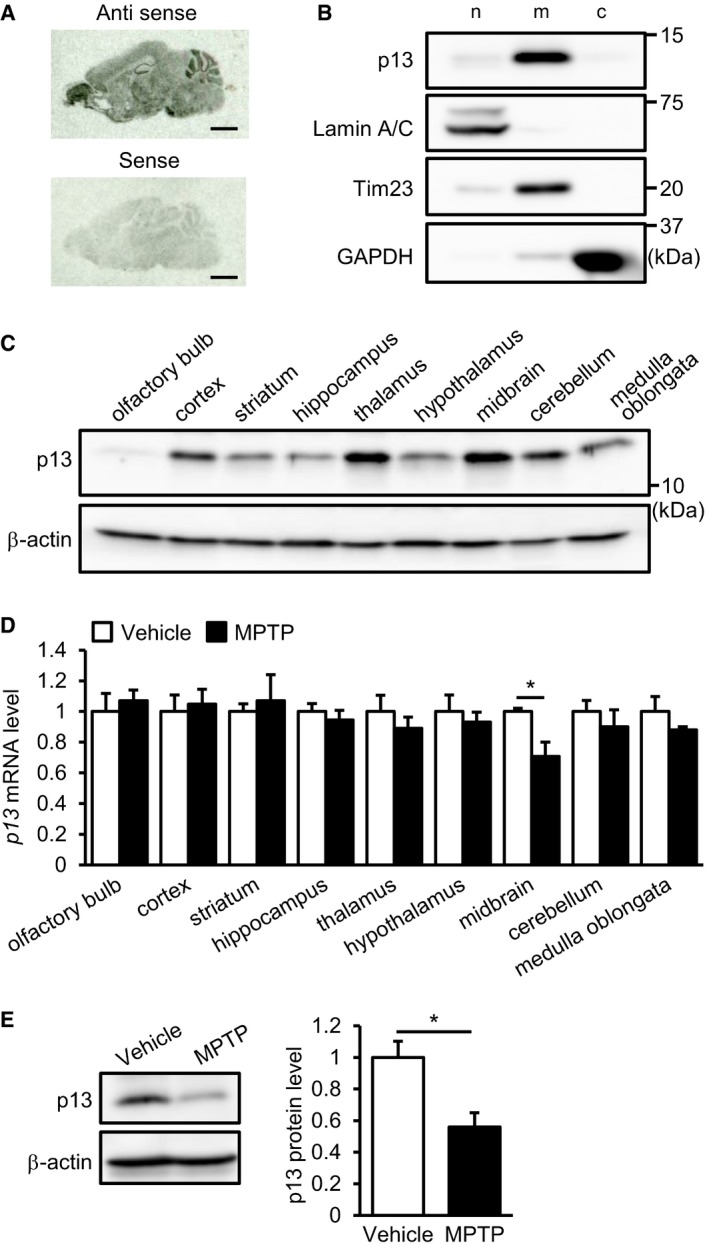
Figure EV4. Distribution of p13 expression in the brain.

- Distribution of p13 mRNA in sagittal brain sections of mice analysed by in situ hybridization. Scale bars, 2 mm.
- Distribution of p13 in nuclear (n)‐, mitochondria (m)‐ and cytosol (c)‐enriched fractions of the mouse brain. The nuclear, mitochondria and cytosol fractions were purified and subjected to Western blotting with antibodies against p13, Lamin A/C (a nuclear marker), Tim23 (a mitochondrial marker) and GAPDH (a cytoplasmic marker).
- Expression of p13 protein in various brain regions of mice. Brain lysates of each region were prepared and subjected to Western blotting with antibodies against p13 and β‐actin.
- Expression of p13 mRNA in various brain regions of mice treated with 10 mg/kg MPTP. mRNA levels were quantified by real‐time RT–PCR. The mRNA level in each brain region of the MPTP‐treated mice was normalized to that of vehicle‐treated mice.
- Expression of p13 protein in the midbrain of mice treated with 10 mg/kg MPTP. Total lysates were subjected to Western blotting with antibodies against p13 and β‐actin. p13 levels were normalized to β‐actin levels.
