-
A
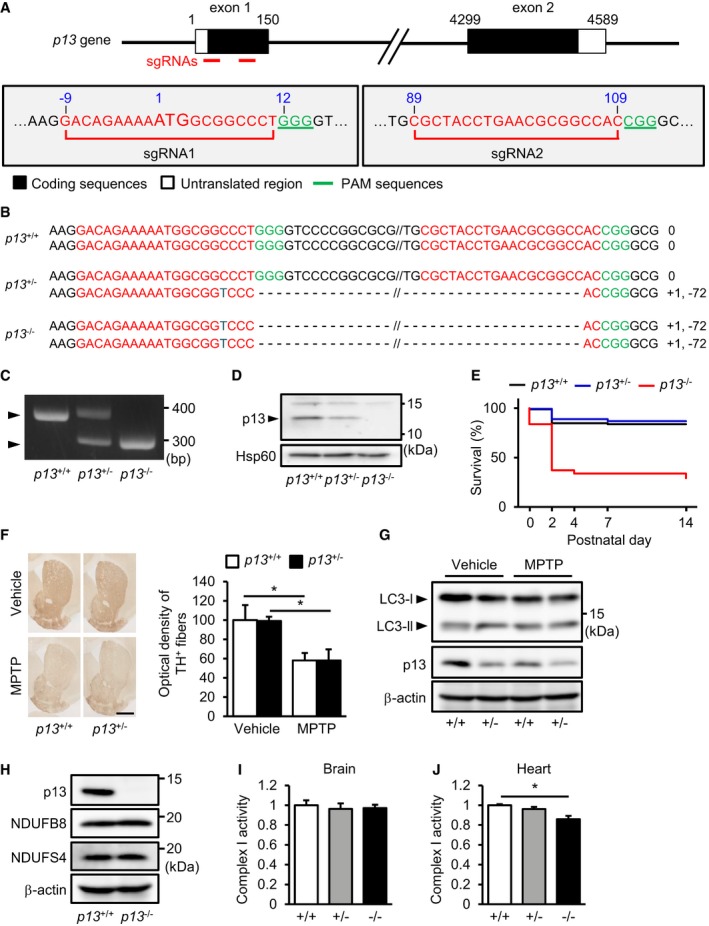
Schematic diagram of single‐guide RNAs (sgRNAs) targeting the mouse p13 gene. Two sgRNA sequences, sgRNA1 and sgRNA2, are shown in red. The protospacer adjacent motif (PAM) sequences are shown in green.
-
B
Genomic sequence analysis of the obtained p13
+/+, p13
+/− and p13
−/− mice. p13
+/− and p13
−/− mice harboured a 71‐bp deletion in exon 1 of the p13 gene.
-
C
Genotyping indicated of
p13
+/+,
p13
+/− and
p13
−/− mice by genomic PCR using primers for
p13 (see
Materials and Methods).
-
D
Expression of p13 in mitochondria from the brains of p13
+/+, p13
+/− and p13
−/− mice. Mitochondrial fractions were purified and subjected to Western blotting with antibodies against p13 and Hsp60 (control).
-
E
Kaplan–Meier survival curves for p13
+/+, p13
+/− and p13
−/− mice (p13
+/+, n = 86; p13
+/−, n = 143; and p13
−/−, n = 65).
-
F
No significant change in the MPTP‐induced decrease in optical density of TH+ fibres in the striatum of p13
+/+ and p13
+/− mice, as analysed by immunohistochemistry (n = 3). Representative images (left) and the quantification of optical density of TH+ fibres in the striatum (right). Scale bar, 1 mm.
-
G
No significant changes in autophagy induction in the substantia nigra of MPTP‐treated p13
+/+ and p13
+/− mice. Autophagy was measured by the conversion of LC3‐I to LC3‐II. Total lysates were subjected to Western blotting with antibodies against LC3, p13 and β‐actin.
-
H
Expression of p13, NDUFB8 and NDUFS4 in the brains of p13
+/+ and p13
−/− mice. Total cell lysates were subjected to Western blotting with antibodies against p13, NDUFB8, NDUFS4 and β‐actin.
-
I, J
Complex I activity in the brains (I) or the hearts (J) of p13
+/+, p13
+/− and p13
−/− mice. Brain or heart extracts were prepared, and complex I activity was measured based on NADH‐oxidizing activity.
= 3). *
< 0.05 by the Tukey–Kramer test (F and J).

