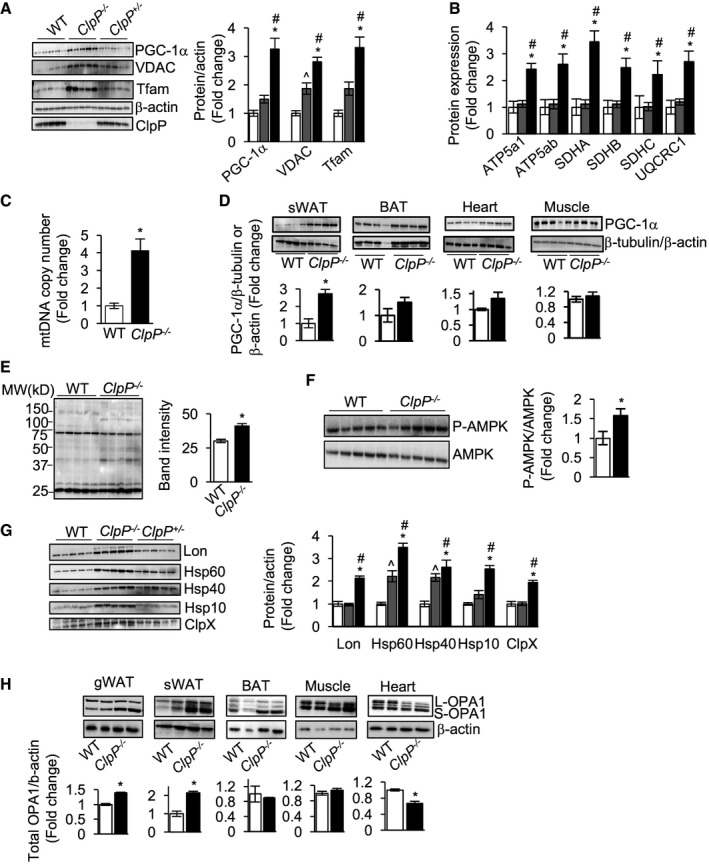
Left panel: immunoblots of gWAT extracts from WT, ClpP
+/−, and ClpP
−/− mice for PGC‐1α, Tfam, VDAC, β‐actin, and ClpP (n = 5). Right panel: graphical representation of quantified blots normalized to β‐actin.
Quantification of protein levels of electron transport chain (ETC) subunits ATP5a1, ATP5ab, SDHA, SDHAB, SDHC, and UQCRC2 in gWAT of WT, ClpP
+/−, and ClpP
−/− mice obtained by mass spectrometry (n = 5).
Quantification of mtDNA/nDNA content in gWAT from WT and ClpP
−/− mice (n = 6–8).
Top panels: immunoblots of sWAT, BAT, heart, and muscle extracts from WT and ClpP
−/− mice for PGC‐1α and β‐tubulin (Western blot shows representative examples for n = 4, and quantification is based on n = 6). Bottom panels: graphical representation of quantified blots normalized to β‐tubulin.
Left panel: immunoblots of gWAT extracts (30 μg/lane) from WT and ClpP
−/− mice for 4‐HNE. Right panel: Quantification of band intensity of the entire line represented graphically (n = 5).
Top panel: immunoblots of gWAT extracts from WT and ClpP
−/− mice for P‐AMPK and AMPK (n = 5). Right panel: graphical representation of the ratio of P‐AMPK to AMPK.
Left panel: immunoblots of gWAT extracts from WT, ClpP
+/−, and ClpP
−/− mice for Lon, Hsp60, Hsp40, Hsp10, ClpX, and ClpP (n = 5). Right panel: graphical representation of quantified blots normalized to β‐actin.
Western blots showing protein expression of OPA1 isoforms and β‐actin in gWAT, sWAT, BAT, muscle and heart of WT, and ClpP
−/− mice (top panel) (Western blot shows representative examples for n = 2, and quantification is based on n = 5). Quantification of the blots normalized to β‐actin is shown as bar graphs (bottom panel).
Data information: Bars represent mean ± SEM (ANOVA, *: WT vs.
vs.
; ^: WT vs.
< 0.05). WT: white bars,
: black bars.