
Figure EV1. Impact of FBXL13 on cell cycle distribution and CEP192 expression levels.
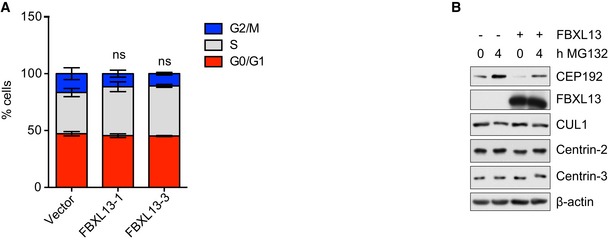
- Quantification of cell cycle profile of HEK293T cells as determined by fluorescence‐activated cell sorting (FACS) using propidium iodide staining. HEK293T cells were transfected with FBXL13 isoform 1 (FBXL13‐1) or FBXL13 isoform 3 (FBXL13‐3). An empty vector (Vector) was used as a negative control (mean ± SD from three independent experiments; ns, non‐significant P > 0.05). The statistical method used was a one‐sample, unpaired Student's t‐test with a hypothetical means of 1.0 between G2/M populations of the treatment conditions compared to control.
- Detection of CEP192, Centrin‐2, Centrin‐3 and CUL1 after expression of FBXL13 in the presence or absence of MG‐132. β‐actin was used as a loading control.