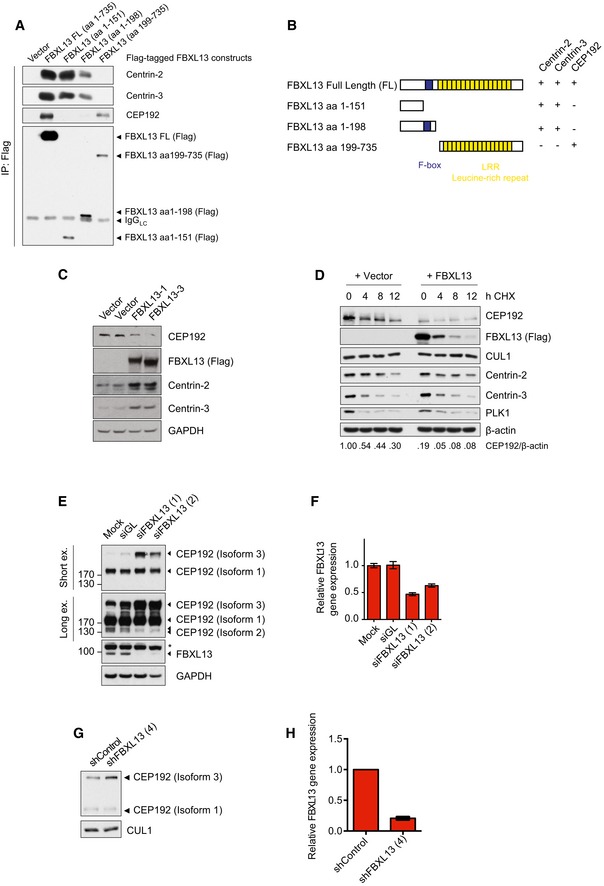
Detection of endogenous Centrin‐2, Centrin‐3 and CEP192 binding to immunoprecipitated Flag‐tagged FBXL13 FL (FL, full length) and fragments from HEK293T cells. An empty vector (Vector) was used as a negative control.
Scheme of FBXL13 full length (FL) and truncation mutants. The F‐box domain is highlighted in blue. The ability of each mutant to bind to Centrin‐2, Centrin‐3 and CEP192 is summarised on the right.
Protein levels of endogenous CEP192, Centrin‐2 and Centrin‐3 in HEK293T cells transfected with FBXL13 isoform 1 (FBXL13‐1), FBXL13 isoform 3 (FBXL13‐3) or an empty vector (Vector) control. GAPDH was used as a loading control.
Protein levels of endogenous CEP192, Centrin‐2 and Centrin‐3 levels in U2OS cells following cycloheximide (CHX) treatment and overexpression of FBXL13 or an empty vector (Vector) control. CUL1 and PLK1 were measured as negative and positive controls for the CHX treatment, respectively. β‐Actin was used as a loading control. Protein band intensities were measured using ImageJ. The ratio of CEP192 to β‐actin was calculated and normalised to protein levels at time point 0 h CHX of the vector control.
Detection of endogenous CEP192 protein levels following FBXL13 depletion by siRNA. U2OS cells were either mock transfected (Mock) or transfected either with siRNAs targeting Luciferase (siGL) or two siRNAs targeting FBXL13 (1 and 2). Two exposures of CEP192 are shown (Short ex. and Long ex.). GAPDH was used as a loading control. The asterisk marks a non‐specific band, FBXL13 is marked by an arrowhead.
Quantification of FBXL13 mRNA levels measured by qPCR from experiment depicted in (E) (mean ± SD from three qPCR triplicates).
Detection of CEP192 protein levels following FBXL13 depletion by shRNA. U2OS cells were transiently transfected with expression vectors for control shRNA or shRNA targeting FBXL13. Following 48 h, cells were harvested and protein levels were analysed by Western blot. CUL1 was used as a loading control.
Quantification of FBXL13 mRNA levels measured by qPCR from experiment depicted in (G) (mean ± SD from three qPCR triplicates).