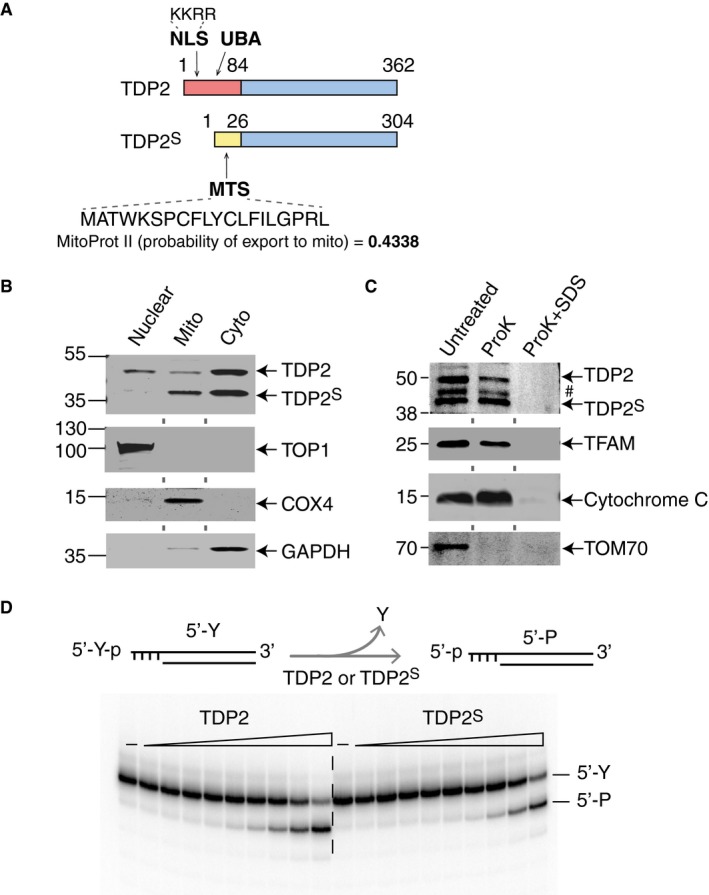
Figure 2. Both TDP2 and TDP2S localize to human mitochondria.

- Schematic representations of TDP2 and TDP2S protein isoforms (full amino acid sequences are shown in Appendix Fig S1). The color scheme is the same as in Fig 1D. NLS and MTS are the nuclear localization and mitochondrial targeting sequences, respectively. UBA is the ubiquitin‐associated domain.
- Representative immunoblots of H226 cell fractions (50 μg nuclear extract and 30 μg mitochondrial and cytosolic extracts). Upper panel probes for TDP2, and the lower panels probe for fractionation markers, TOP1, COX4, and GAPDH.
- Proteinase K protection assay of purified mitochondria from H226 cells. Upper panel probes for TDP2 (#: non‐specific band). Lower panels probe for TFAM, cytochrome C, and TOM70, which are fractionation controls for mitochondria.
- Representative biochemical assay for 5′‐phosphotyrosine cleavage activities of both recombinant TDP2 and TDP2S. Double‐strand DNA substrate bearing a 5′‐tyrosine (5′‐Y) on a four base overhang is radiolabeled on the 3′‐end and incubated with increasing concentrations of recombinant TDP2 or TDP2S (1:3 serial dilutions ranging from 3 pM to 18 μM) for 2 h. 80 μM of cold single‐strand DNA is included as competitors to reduce non‐specific degradation. The rates of DNA product (5′‐P, with a 5′‐phosphate end) generation by both isoforms are comparable.
Source data are available online for this figure.
